
It may be difficult to recall a time when a litre of gas was 52 cents and a carton of eggs was just $1.64. That was 30 years ago. Fast forward to today, and Canada has now earned the title of “food inflation capital” of the G7 (Group of Seven advanced economies), with food prices rising by 6.2 percent in 2025 alone.1 In response, Prime Minister Carney recently introduced the Canada Groceries and Essentials Benefit (CGEB) rebate (an expansion of the existing GST/HST rebate) targeted at low-income earners.
While the Consumer Price Index (CPI), the federal government’s official measure of inflation, suggests average prices have risen roughly 88 percent over three decades, your grocery bills likely tell a very different story (chart). Inflation becomes especially troubling when incomes fail to keep up. For a growing portion of the population, this is a reality. When expenses, especially those like education and housing, become harder to afford, the impact is not just financial; it can influence confidence in economic opportunity and heighten social divides.
While affordability has come under increasing pressure, long-term investment performance paints a more encouraging picture. Throughout the same period, investors have seen the S&P/TSX Composite Index rise more than 573 percent, even before accounting for reinvested dividends. That growth has outpaced the price increases across every category on the chart, including average home prices during a prolonged housing boom.
Of course, those gains did not come without volatility, including four bear markets spanning a combined 40 months, two of which saw declines of more than 45 percent. Still, for those who stayed the course, equities have proven to be one of the most effective tools for building wealth and offsetting inflation over the long run. If history is any guide, that’s encouraging news for long-term investors looking ahead to the next 30 years.
1. www.theglobeandmail.com/business/article-food-inflation-retail-decoder/
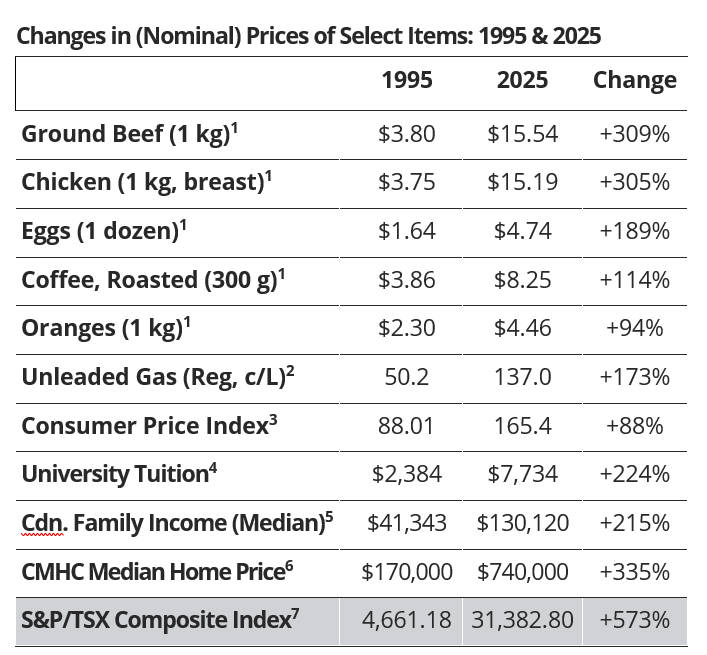
1. Statistics Canada (StatCan) T-18-10-0002-01 (November 1995 data); Table: 18-10-0245-02 (November 2025 data); 2. StatCan T-18-10-0001-01 (November 1995 & 2025 data, Toronto); 3. https://www.bankofcanada.ca/rates/price-indexes/cpi/; 4. https://www150.statcan.gc.ca/t1/tbl1/en/tv.action?pid=3710004501; 5. https://open.canada.ca/data/en/dataset/cf5a0c30-8893-11e0-b0f5-6cf049291510; StatCan T-1110019101; for 2025 data, $121,000 (2023), with 3.6% (2024) & 3.8% (2025) wage growth assumptions; 6. CMHC New Build Median Price; https://www.cmhc-schl.gc.ca/professionals/housing-markets-data-and-research; 7. At close 11/30/95 and 11/28/25.