Hale Investment Group: March Update
 Dear Friends and Clients,
Simon recently returned from a ski trip out West to Banff, hitting the slopes at Lake Louise and Sunshine Village. He noted that staying at a hotel 7,000 feet above sea level makes for some pretty thin air, leaving folks gasping for breath just trying to bend down and tie their boots.
Here in Quebec, it is finally starting to warm up with spring around the corner. After some colder weather it’s funny how warm -5 C feels.
We are heading into tax season. Mary and the rest of our team are here to assist with all your tax preparation needs and coordinate with your accountants. Please remember that tax slips often arrive at the very last minute, so we appreciate your patience as the paperwork rolls in.
Portfolio Performance & Measuring Success
Global markets have been relatively flat since October, and our portfolios have largely tracked that sideways movement. However, when we look under the hood, we are quite pleased with where we stand in terms of positioning.
For this month’s Performance reporting we have compiled our original benchmarks for each strategy from when they were launched to give a more accurate comparison for each. We are also now including Morningstar Categories, which is a tracked and audited collection of the performance of all Canadian asset managers to see where we stand relative to other portfolio managers in the class of each strategy. This allows us to compare our performance against the actual average of other professional managers running similar strategies, giving you a truer picture of our relative success.
| Investment Performance (%) | |||||
| As of February 27, 2026 | YTD | 1Y | 3Y | 5Y | SI |
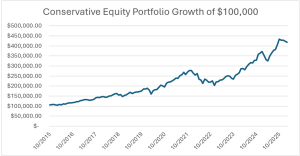
| CONSERVATIVE EQUITY GROSS RETURN (CAD) | -2.4% | 18.6% | 23.7% | 13.1% | 14.7% |
| Benchmark (50% DJ US Div 100; 45% S&P/TSX 60, 5% S&P Can T-Bill) | 10.8% | 22.6% | 14.0% | 11.1% | 11.0% |
| Morningstar Category (Global Neutral Equity) | 1.5% | 10.1% | 12.2% | 8.2% | 7.5% |
| DIVERSIFIED INCOME GROSS RETURN (CAD) | -0.5% | 11.6% | 14.2% | 9.7% | 10.7% |
| Benchmark (35% S&P Can Bond; 25% S&P Can Div; 25% DJ US Div 100; 10% MSCI EAFE, 5% S&P Can T-Bill) | 8.2% | 17.1% | 12.3% | 9.1% | N/A |
| Morningstar Category (Global Neutral Balanced) | 1.1% | 7.9% | 10.0% | 6.3% | N/A |
| FOCUSED TOTAL RETURN GROSS RETURN (CAD) | -0.7% | 25.7% | 28.8% | 17.3% | 22.0% |
| Benchmark (40% DJ US Div 100; 35% S&P/TSX 60, 20% S&P Can Bond, 5% S&P Can T-Bill) | 9.0% | 18.3% | 12.3% | 9.1% | N/A |
| Morningstar Category (Tactical Balanced) | 1.5% | 8.6% | 8.7% | 5.5% | N/A |
| *Your own returns will vary depending on the amount of fixed income you hold, cash flows in and out, and management fees. | |||||
| LARGEST MUTUAL FUND IN CANADA (1.94% MER FEE) | YTD | 1Y | 3 yr | 5 yr | 10 yr |
| RBC SELECT BALANCED PORTFOLIO FUND (A) NET RETURN (CAD) | 4.3% | 13.6% | 12.5% | 7.0% | 7.3% |
Some of the names that are now performing the best are CP and CN Rail. We had reviewed them for lack of performance on our January call but believed they would do well this year. So far we have been correct, with CP up close to 20% this year.
On the side of worst names this year, Microsoft is down 15% due to it being a software name. All software companies have plunged in value this year as there are increasing fears of disruption from artificial intelligence (AI). We continue to hold our position as we see Microsoft as a diversified business with much of their software business being more foundational than others. We do, however, agree strongly that AI represents a huge disruption to many sectors that will lower the protective moats of businesses and increase competition.
The “Bananas” Pace of AI & Our Conviction in Amazon
The advancements we have seen in AI over just the last few months have been nothing short of bananas. We have moved rapidly from using large language models for simple research queries to utilizing “agentic” AI. Today, you can give an AI agent a complex objective—like starting a business, gathering quotes from contractors, or writing an entire software program—and it will independently execute those tasks for you.
To power this revolution, the world’s largest tech companies are spending staggering amounts of money. Total capital expenditures (CapEx) for AI infrastructure among the major “hyperscalers” is jumping from under US$400 billion last year to an estimated US$600 billion this year.
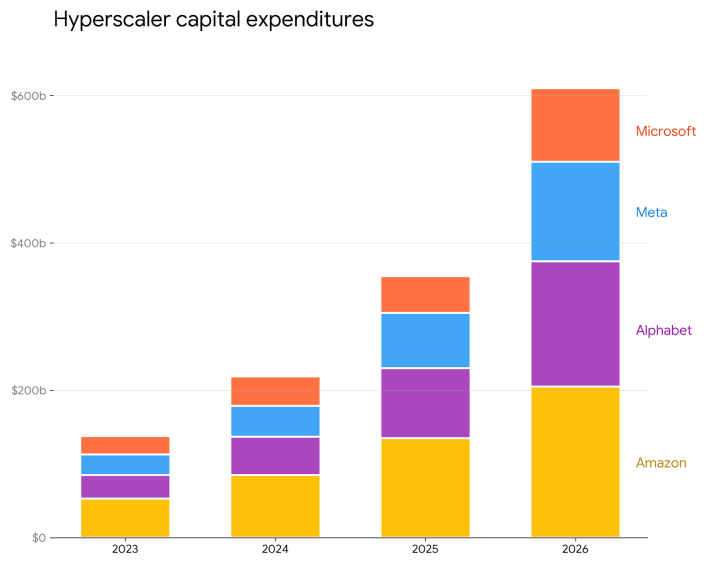
*Data from each companies quarterly fillings and guidance as of 2/27/2026
This brings us to Amazon, which we have recently added across most of our portfolios, making it one of our highest conviction holdings. Amazon is spending roughly US$200 billion this year on CapEx. While the broader market briefly sold off the stock out of fear over this massive spending, we see it as an incredible competitive moat. They are building “AI factories” that are cash-flow positive from day one due to insatiable demand.
In their core retail business, Amazon’s biggest costs are labour and transportation. As you can see in the chart below, while their human headcount peaked in 2021 at around 1.6 million employees and went sideways, their deployment of robots has aggressively scaled up, recently crossing the one million mark. This robotic efficiency, combined with future autonomous driving, gives them tremendous room to expand their profit margins.
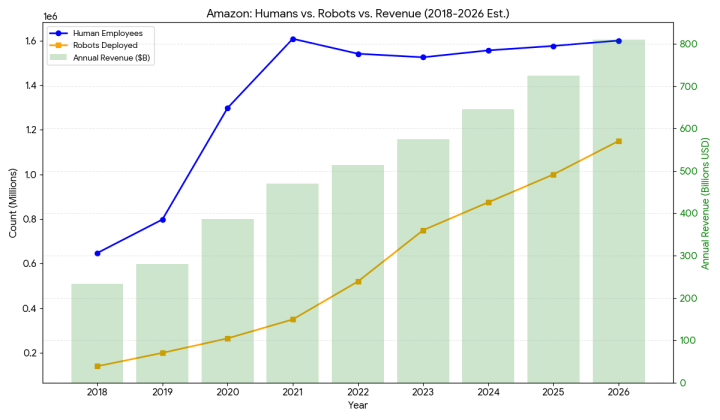
*Data from Amazon company statements and financial filings as of 2/27/2026
Furthermore, we were able to purchase these additional shares when the stock dipped to around 13 times cash flow. Historically, buying Amazon at that valuation has presented an exceptional long-term opportunity.
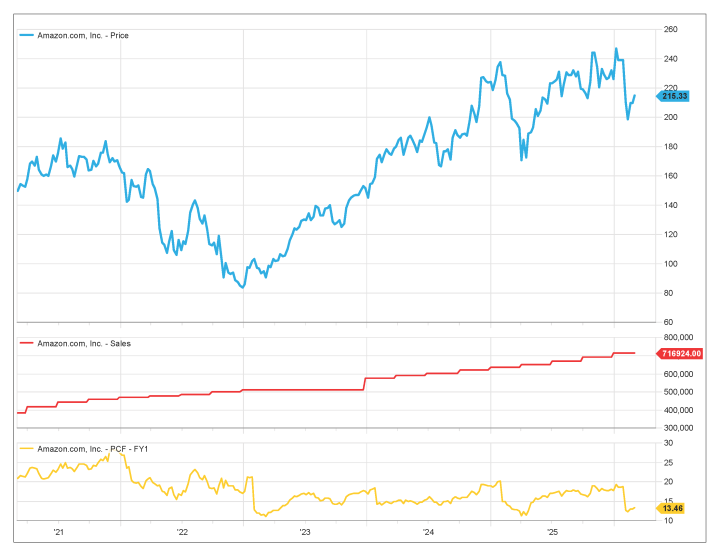
*Financial data compiled by FactSet from company financial filings and guidance as of 2/27/2026
The above chart shows the price of Amazon represented by the blue line. Below it is the trailing 12 months revenue, and the yellow line is a valuation multiple of the price versus the estimated cash flow over the next year . You can note the last two times Amazon reached 13x price/cash flow were tremendous buying windows.
A Quick Note on Nvidia: We maintain our large position in Nvidia, which recently reported an astonishing 73% year-over-year revenue increase for the quarter. Despite this explosive growth, the stock has traded relatively sideways. Because their earnings are growing much faster than their share price, Nvidia is currently trading at a very reasonable 17 times next year’s earnings, meaning the investment has actually become less risky over the last six months.
Global Markets & The Middle East Conflict
With the recent outbreak of conflict involving Iran, Israel, and the U.S., we have seen understandable volatility return to the markets. It is a common misconception that markets hate bad news; in reality, markets hate unpredictable news.
When the conflict threatened the Strait of Hormuz—a vital checkpoint for global energy—the price of oil spiked rapidly from US$65 to $75 a barrel because the near-term supply became unpredictable. Higher oil prices feed directly into transportation costs, which can reignite inflation and slow down the interest rate cuts we have been expecting.
However, we view this as a temporary disruption. While roughly 20 million barrels of oil flow through the Strait of Hormuz daily, alternative pipelines through Saudi Arabia and the UAE can divert about 40% of that volume. Moreover, the world has massive strategic reserves to lean on. The U.S. holds roughly 500 million barrels, and China maintains a reserve of one billion barrels.
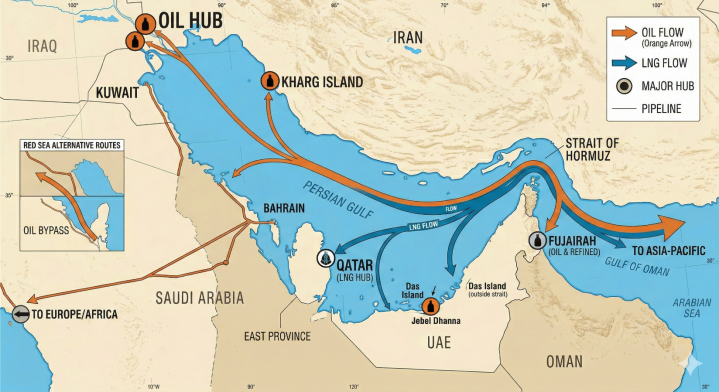
Liquified Natural Gas (LNG) is even more affected than oil. Qatar hosts the world’s largest LNG export facility that accounts for approximately 20% of the world’s LNG supply. It was temporarily paused after a drone hit the facility causing small amounts of damage. LNG has very small reserves and the prices have spiked much more than oil, particularly in Asia which gets most of its LNG from the Middle East.
Ultimately, this conflict reminds the world why relying on politically unstable regimes for energy is inefficient. Ironically, this situation actually benefits the Canadian energy sector, making our oil and natural gas exports much more desirable to allies like Japan who prioritize security and stability. Nuclear energy, of which Canadian companies are very much involved, is also looking like a better and better option.
We continue to monitor this situation closely. The question in the bond and equity markets is: how long will the energy disruption last—days, weeks, or months?
The Pitfalls of Private Credit
Finally, you may have read about recent turbulence in the private credit and private equity markets. Over the last few years, a lot of capital has chased a shrinking pool of quality private loans. Recently, Blue Owl Capital—the 10th largest private lender—ran into cash issues, halted redemptions, and saw its stock plunge roughly 45% in six months.
This has sent shockwaves through other major private equity firms like Blackstone and KKR. We frequently get asked why we don’t invest in private debt. Our answer remains the same: we avoid it due to the lack of transparency, lack of liquidity, and significantly higher fees compared to public markets. We remain disciplined in this approach, and it has kept us safely insulated from this current mess.
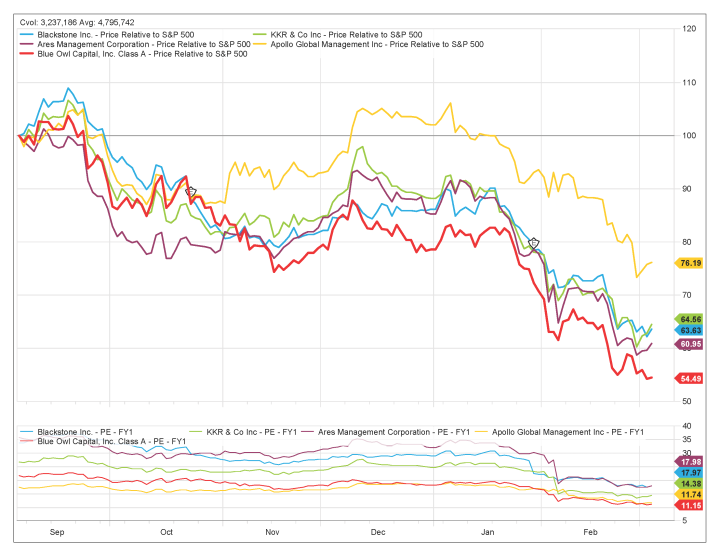
*Data from FactSet as of 2/03/2026
Our Outlook
Despite the noisy headlines, we still believe we are in a “Goldilocks” environment for investors. Inflation is trending down, interest rates are poised to follow, and corporate earnings are consistently growing at a double-digit pace of 10–15%. That is a wonderful recipe for long-term growth.
With St. Patrick’s Day just around the corner, we’ll leave you with a favourite Irish blessing:
“May the road rise to meet you. May the wind be always at your back. May the sun shine warm upon your face.”
Warm regards,
Michael & Simon
Hale Investment Group