Hale Investment Group – Monthly Client Update December 2025
Dear Clients and Friends,
We hope this letter finds you warm and getting ready for the holidays.
If you walked into Michael’s living room this week, you’d see a Christmas tree that looks a little different than usual. Because there is a baby in the house, the bottom half of the tree is decorated strictly with stuffed animals—soft enough that if they get pulled down, nothing breaks. Meanwhile, over at Simon’s place, he has been up on an extension ladder trying to finish the top of his tree.
Whether your tree is baby-proofed or requires a ladder, we hope you’re enjoying the season. It’s been a busy year and as we head into the final stretch, we wanted to take a moment to wish you and your family a safe and happy holiday season.


Performance Summary
To put it plainly, 2025 has been a very good year for investors.
| 2025 MARKETS (as of 11/30/2025) | YTD |
| TSX 60 TOTAL RETURN (CAD) | 27.4% |
| S&P 500 TOTAL RETURN (USD) | 17.8% |
| NASDAQ COMPOSITE TOTAL RETURN (USD) | 21.7% |
| DOW JONES INDUSTRIAL AVERAGE TOTAL RETURN (USD) | 13.9% |
| S&P CANADA ALL BOND INDEX TOTAL RETURN (CAD) | 3.8% |
| HALE INVESTMENT PORTFOLIOS | YTD | 3 yr | 5 yr | SI |
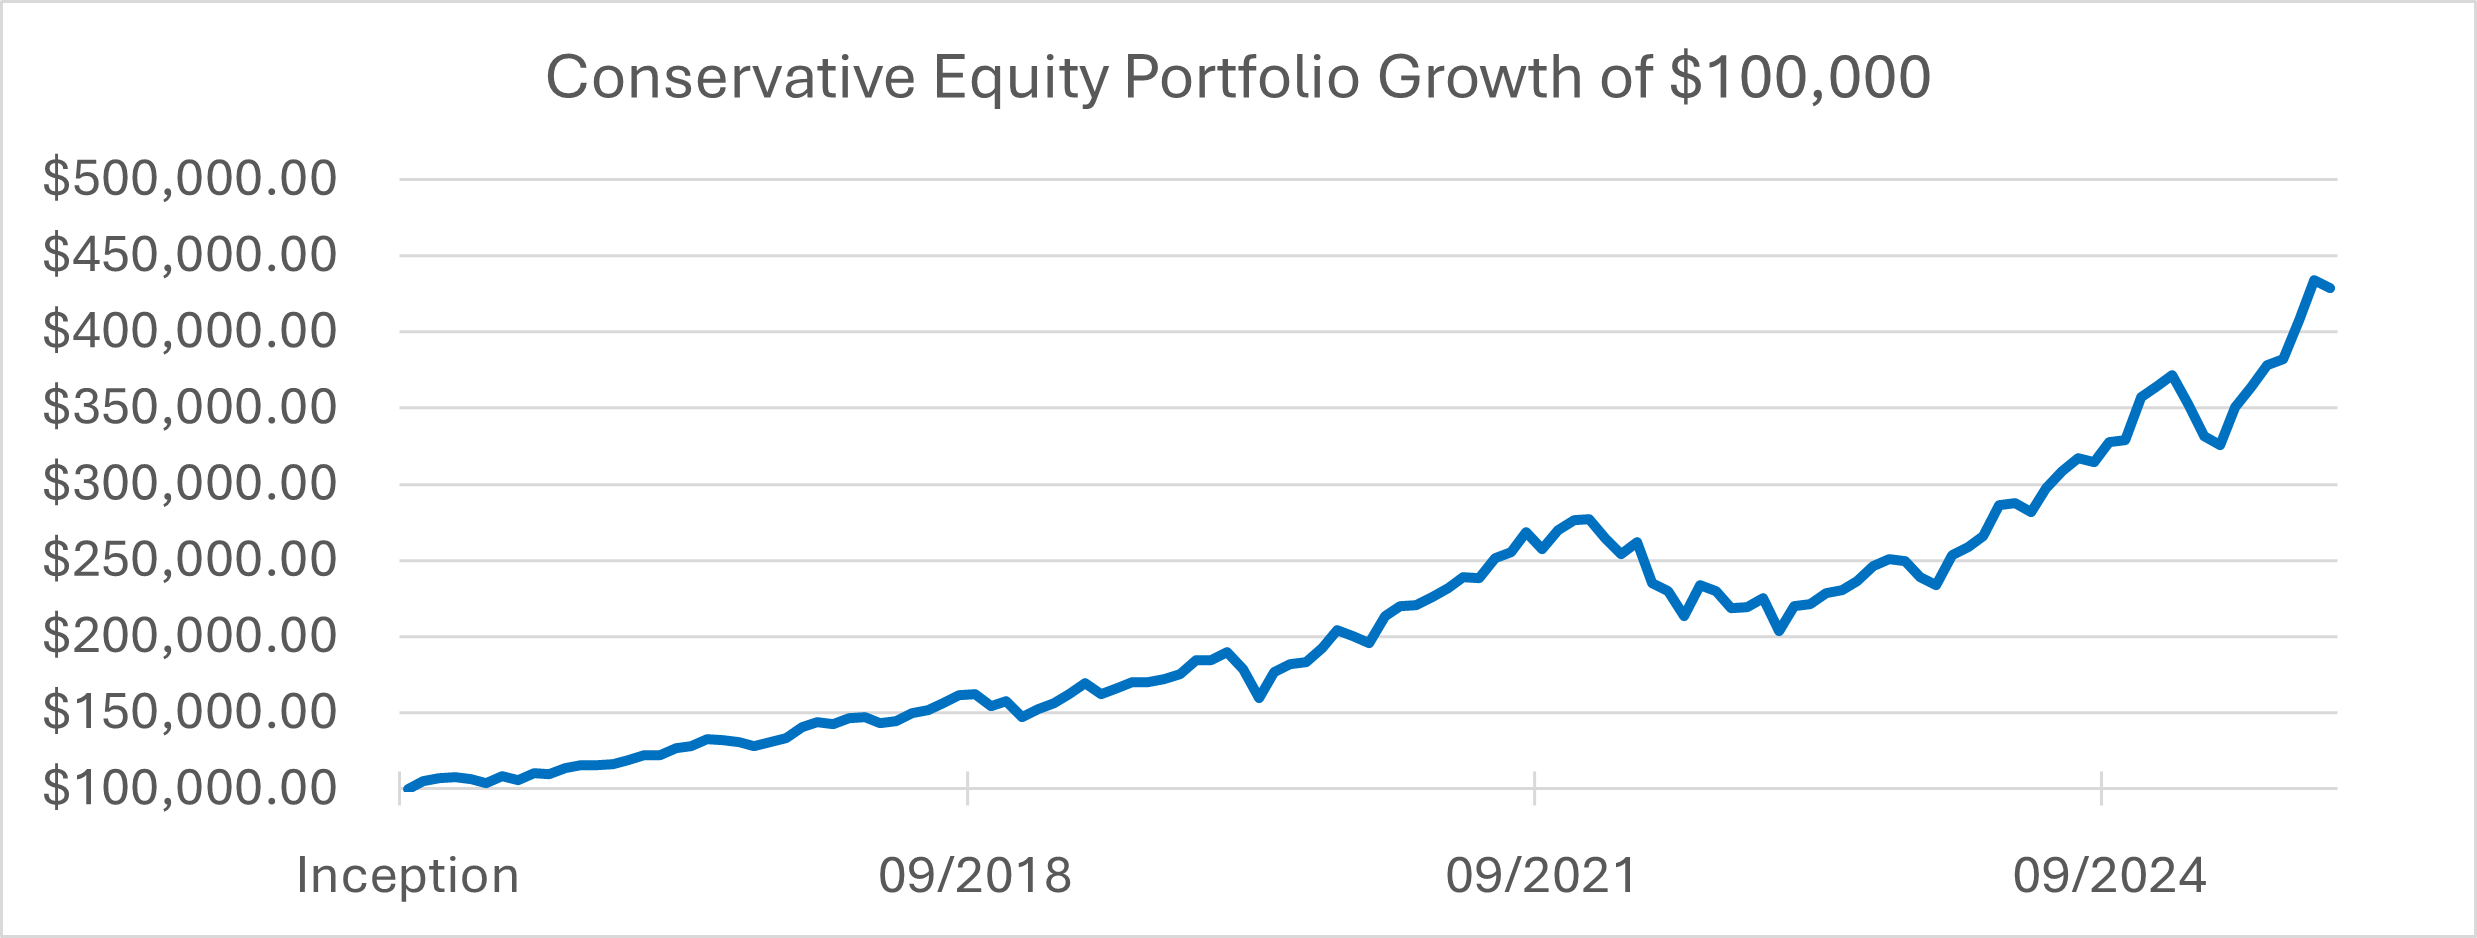
| CONSERVATIVE EQUITY TOTAL GROSS RETURN (CAD) | 17.6% | 23.9% | 15.0% | 15.4% |
| DIVERSIFIED INCOME TOTAL GROSS RETURN (CAD) | 13.0% | 13.8% | 10.8% | 11.1% |
| FOCUSED TOTAL RETURN TOTAL GROSS RETURN (CAD) | 18.7% | 30.2% | 18.1% | 23.1% |
*Your own returns will vary depending on the amount of fixed income you hold, cash flows in and out, and management fees
| LARGEST MUTUAL FUND IN CANADA (1.94% MER FEE) | YTD | 3 yr | 5 yr | 10 yr |
| RBC SELECT BALANCED PORTFOLIO FUND (A) NET RETURN (CAD) | 12.1% | 11.6% | 6.5% | 6.5% |
A $100,000 investment in our Conservative Equity strategy ten years ago would be sitting near $430,000 today. That is the power of compounding.
Portfolio Changes: Pruning and Planting
With a number of strong years behind us, we have found it prudent to take profits on some of our larger positions that have grown the most and deploy that capital in other areas to maintain a diversified approach. This has caused larger capital gains in taxable accounts for 2025 when compared to previous years. To offset this impending tax bill, we looked for areas to trim where we could take losses. The only two positions with losses available have been Northland Power and Oracle.
Selling Northland Power (NPI) We decided to exit our position in Northland Power. We like the assets—wind and solar are important—but management just hasn’t been executing. They cut their dividend by 40 percent to shore up cash and took a $500 million write-down on assets. In this business, if you aren’t executing, we move our capital to someone who is.
Adding to Metro We moved that capital into Metro. It’s a boring business, and we love boring businesses that make money. It’s a reliable, “sleep well at night” stock that has traditionally held up when markets get rocky.
Selling Oracle (ORCL) We also sold Oracle, taking a small loss on the position, and moved the proceeds to a semiconductors ETF for 30 days. We will more than likely buy back the shares after 30 days.
High Yield Bonds In the fixed-income portfolio, we’ve added a position in the Fidelity American High Yield Bond Fund. This effectively increased the overall yield of our bond portfolio. We’ve invested in this fund during the financial crisis, and it’s proven to be very well managed.
New Investment: Micron Technology
We have initiated a new position in a U.S. company called Micron Technology.
Growing up in a farming community, we like to use analogies that make sense to us.
If you think of the new artificial intelligence (AI) chips from Nvidia and CPUs of AMD as the combines and tractors doing the heavy work in the field, then Micron provides the barns and silos. You can have the best harvest in the world, but you need a place to store your crop while you process it and prepare to send it to the market.
Micron Technology (MU) represents a compelling addition, bolstering our exposure to the memory segment of semiconductors. With approximately 26 percent global market share, Micron ranks third behind Samsung and SK Hynix but stands out as the U.S.-based leader, mitigating geopolitical risks tied to Asia. Its customer base spans Nvidia, Broadcom, Google, and Amazon, offering a more balanced diversification to their Korean competitors.
Micron is fully booked through 2026, growing their top line by about 50 percent, having advanced ahead of competitors in high-performance “working memory” essential for AI’s rapid data handling. For fiscal 2026, estimates project $78 billion in revenue, $49 billion in EBITDA, and a forward P/E of 13x on a $272 billion market cap.
They divide their memory into two categories;
| NAND (Flash Memory) | |
| Long-Term Storage | 512 GB iPhone or Android |
| Data remains without power | Solid State Drive (SSD) in Computer |
| Slower to access | USB Thumb Drive |
| Cheap per GB | SD Camera Card |
| DRAM (Dynamic Random Access Memory) | |
| Short-Term “Thinking” Memory | 16 GB RAM in Computer |
| Vanishes without power | Memory on Graphics Card |
| Super fast to access | Massive memory bank in Data Centre |
| Expensive per GB | “Thinking” memory of robots / cars / drones |
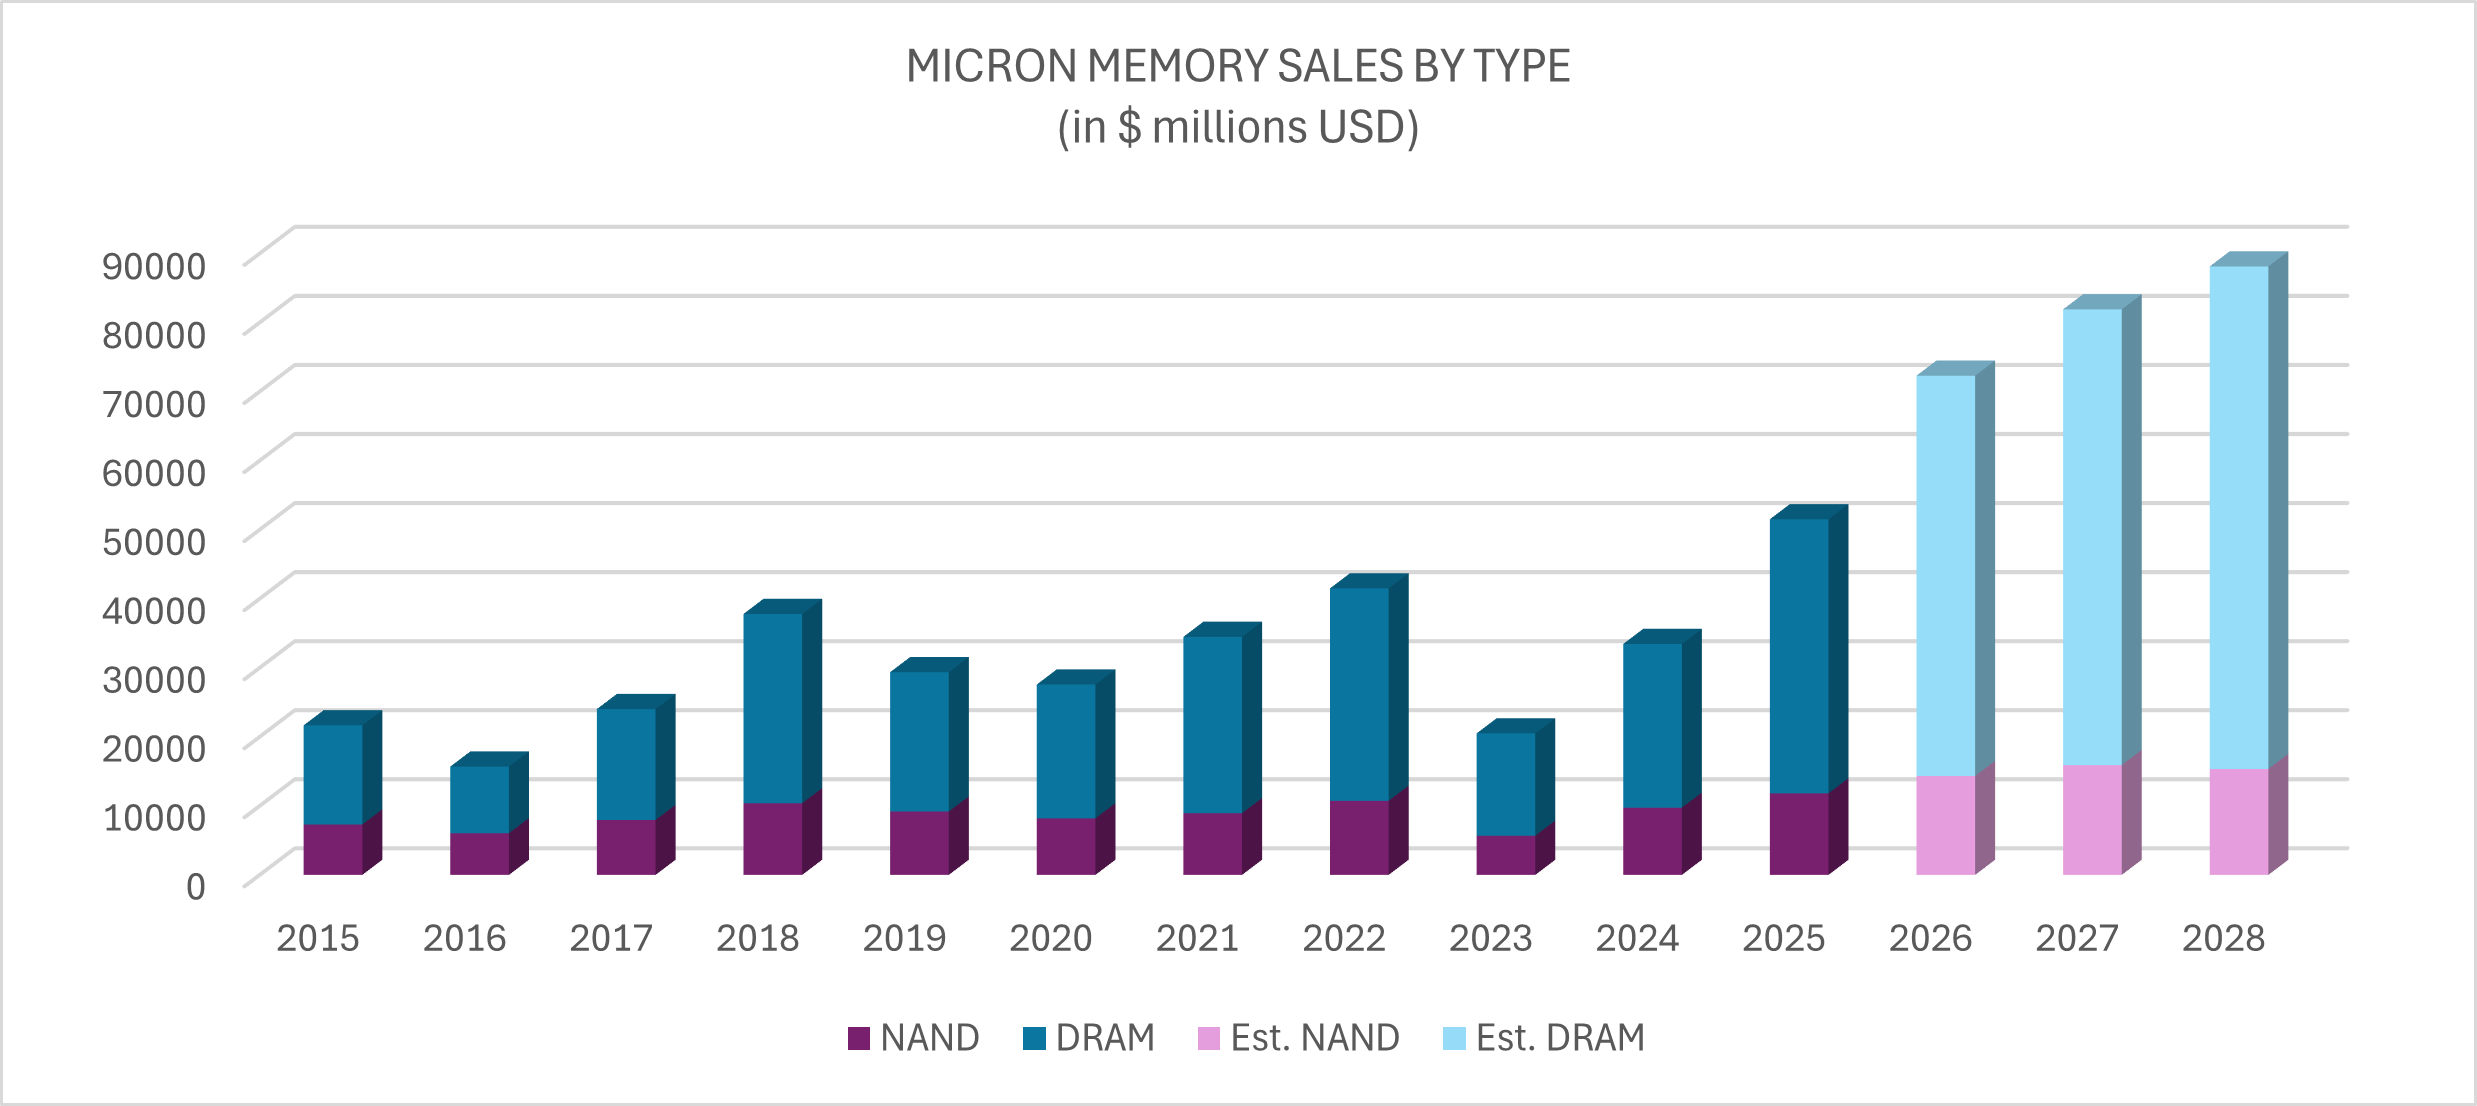
*Data and consensus estimates from FactSet
Rapid Fire Updates
We keep a close eye on the companies you own. Here is a quick summary of recent earnings:
- Home Depot: Sales grew modestly by 2 percent, reflecting a housing market tempered by elevated rates, yet margins held firm at 13 percent—ahead of Lowe’s 11 percent. A reliable performer in challenging conditions.
- Canadian Banks: Bank of Nova Scotia exceeded expectations in revenue and profits, driven by wealth management and capital markets, offset slightly by restructuring costs from a 3 percent workforce reduction. Royal Bank and National Bank reported similar strengths, with no significant credit impairments emerging. Wealth Management and Capital Markets were the bright spot.
- Metro Inc.: Pharmacy sales rose 4.8 percent, outpacing inflation in food, with a 20 percent increase in online groceries. Earnings beat estimates, complemented by $790 million in share repurchases and $316 million in dividends—equating to 4.5 percent returned to shareholders annually.
- Nvidia: Delivered 66 percent year-over-year revenue growth and substantial beats, though shares dipped amid external factors like SoftBank’s $20 billion stake sale for alternative AI investments and exaggerated reports on Michael Burry’s modest options positions. Fundamentals remain robust; market noise, as ever, is just that—noise.
A Word on “Bubbles”
We get asked often: “Is this AI thing a bubble?”
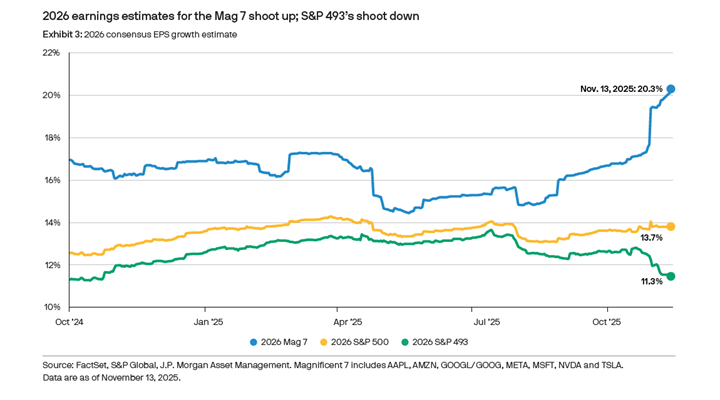
It is a fair question. But when we look at the numbers, we don’t see a bubble; we see earnings.
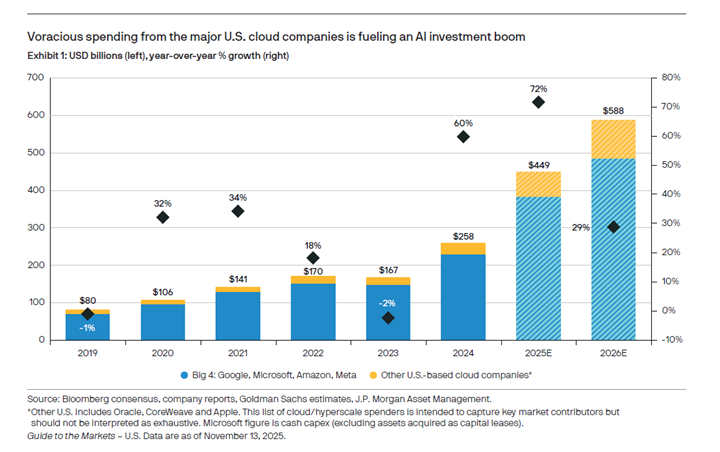
J.P. Morgan released data showing that the “Magnificent 7” tech companies are expected to grow earnings by over 20 percent looking into 2026. Companies are spending hundreds of billions of dollars on this infrastructure because they have to and it’s profitable.
Economic Outlook: Rates and Beyond
We foresee continued U.S. easing into 2026, with Canada potentially following suit in early quarters despite a possible pause—current levels remain elevated relative to economic softening.
AI infrastructure spending continues to underpin U.S. gross domestic product (GDP) growth. Potential headwinds include supply constraints like power infrastructure delays or rare earth material shortages, which could prompt a temporary “reverse wealth effect” as markets cool. However, our base case remains optimistic: assuming no recession in sight, with S&P targets of 7,000 by year end, 8,500 by end of 2026, and ~15 percent annual compounding to roughly 15,000 by 2030. Dips are opportunities, not detours.
Closing Thoughts
As the Farmers’ Almanac predicts a chilly December—ideal for skiers and hot cocoa—we remain focused on delivering enduring value. Our team is fully available through the holidays.
Wishing you a Merry Christmas, Happy Holidays, and a prosperous 2026. Next update: Our January predictions. Stay warm out there folks.
Sincerely,
The Hale Investment Group