
I’ve had more conversations this month about whether we’re living through a bubble or a genuine turning point than at any time in my career. It’s the trillion-dollar question—literally—and I think it deserves some serious attention.
After carefully weighing both sides, our view is clear: we believe we are living through a genuine generational shift, one that will reward disciplined, well-positioned investors. But the concerns are real, and they deserve an honest hearing before making that case.
Be forewarned though, I got a bit carried away.
The bubble thesis—and why it deserves respect
Let’s start with the bearish case, because ignoring it would be intellectually dishonest. The numbers that worry people are real:
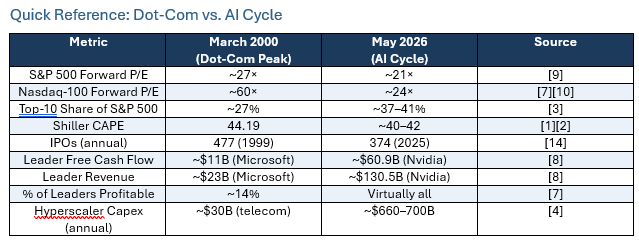
Valuations are extreme. The Shiller CAPE ratio for the S&P 500 sits near ~40× right now—the second-highest reading in over 155 years of market data. 1 2 The only time it was higher? December 1999. We all know how that ended.
Concentration is off the charts. The top 10 companies in the S&P 500 now make up roughly 37–41% of total market capitalization. At the dot-com peak, that number was ~27%. Today’s market is more top-heavy than anything we’ve seen before. 3
The spending is staggering. Amazon, Alphabet, Meta, and Microsoft are on pace to spend a combined $660–$700 billion on Artificial Intelligence (AI) infrastructure this year alone. 4 Sequoia Capital’s David Cahn has done the math: the AI ecosystem needs roughly $600 billion in annual revenue to justify that spending. It currently generates somewhere between $50 and $100 billion. That’s a big gap. 5 So the question remains: what happens if this revenue doesn’t catch up to rationalize this big spend out? I would surmise that we have 2-3 years of “grace” before the markets become very impatient and punish those companies unable to make the grade.
The smart money is nervous. In Deutsche Bank’s December 2025 global survey, 57% of institutional fund managers named an AI valuation crash as the single greatest risk to markets. Their strategist Jim Reid noted: “We’ve never had such a big leader in the biggest risk stakes for the year ahead.” 6
These aren’t fringe concerns. They’re legitimate data points, and investors should take them seriously and keep these concerns firmly in mind when investing.
The generational change thesis—and why we think it’s the stronger case
Now, here’s where it gets interesting. Because when you look a bit deeper, the dot-com comparison starts to fall apart:
Profitability is real. In 2000, only about 14% of the leading tech companies were actually profitable. 7 Today? The AI cycle is being bankrolled by the most profitable companies in history. Nvidia posted $130.5 billion in revenue in fiscal year 2025 – up 114% -with $72.9 billion in net income and $60.9 billion in free cash flow. 8 These aren’t web startups burning through venture capital. These are money-printing machines
Valuations are high, but they’re not 2000 high. This is VERY important! The Nasdaq-100 forward P/E hit an absurd ~60× at the dot-com peak. 7 Today? About ~24×. 10 The S&P 500 forward P/E is roughly 21× versus 27× back then. 9 Stretched? Yes. Insane? Maybe not so much.
Revenue is actually showing up. Google Cloud revenue surged 63% year-over-year to $20 billion in Q1 2026.11 Microsoft’s AI business is running at a $37 billion annualized rate, up 123%. 12 AWS just posted its fastest growth in 15 quarters at 28%. 13 This isn’t vaporware. Real companies are paying real money for real AI capabilities.
The speculative frenzy is missing. In 1999, there were 477 IPOs – many from companies with no revenue, no product, and sometimes no business plan. In 2025 there were 374 IPOs, and the vast majority are established, revenue-generating companies. 14 The IPO market is cooler, capital is more disciplined, and the big spenders are real enterprises, not day traders chasing the next Pets.com with the thesis of websites chasing eyeballs.
Productivity gains are measurable. Goldman Sachs research found a median reported productivity gain of approximately 30% for specific localized AI use cases, while the BCG/Harvard “Jagged Frontier” study showed workers completed tasks 25% faster with 40% higher quality when working within AI’s capability boundary.15 So, while many people, including us, remain skeptical we need to keep an open mind to how AI is changing the way we work, think and build.
Where we stand: A structural shift—with eyes wide open
We don’t dismiss the skeptics. Valuations are stretched. Market concentration is at historic levels. The scale of spending is unprecedented outside of wartime. Those are facts.
But unlike 2000, this cycle has three critical differences:
- Financed by cash, not hope. The companies building AI infrastructure generate trillions in combined revenue and hundreds of billions in free cash flow.8 11 12 13 The dot-com bubble ran on venture capital and fairy dust. This one runs on earnings.
- The risk is overcapacity, not bankruptcy. If the buildout overshoots—and it might—the likely result is excess capacity and margin pressure, not a wave of insolvencies. Think fiber optics after 2000: the infrastructure got built, got used, and eventually created enormous value. It just took longer than people expected.
- The technology works today. AI isn’t a science project. It’s generating real revenue, real productivity gains, and real competitive advantages right now.15 The question isn’t whether it works—it’s how fast the returns scale and create returns to the capital investments.
Could we see a 15–25% correction if capex returns disappoint? Absolutely. But a correction within a secular trend is not the same thing as a bubble bursting. The investors who sold Amazon at $107 in 1999 were “right” for two years – and wrong for the next twenty. This kind of intestinal fortitude is not for the faint of heart by any means!
Our base case: we are in the early stages of a generational transformation, not a speculative mania. The discipline is in how we position – selectively, with an emphasis on real earnings, strategic moats, and durable competitive advantages.
A changing world order
The rules have changed
For nearly 80 years, the global economy ran on a fairly predictable playbook: open trade, stable alliances, expanding globalization. That playbook is being rewritten.
What’s replacing it isn’t chaos—but it is messier. A more fragmented, multipolar system where geopolitics, energy, trade policy, and technology are no longer separate conversations. They’re all one conversation now. 16 17
“Geopolitics is once again a defining market force, reshaping supply chains, capital flows, and corporate strategy. This shift is structural, not cyclical.” — Morgan Stanley Institute, April 2026 16
“The world is not collapsing—it is being rewired. More fragmented, yet still deeply interconnected.” -JPMorgan Chase International Council 17
For us as investors, this means the geopolitical environment is no longer background noise. It’s a primary driver of where capital goes, how risk gets priced, and how portfolios need to be built. Investors investing into countries like Canada need to be hyper aware of this.
The Iran conflict: A real-time stress test
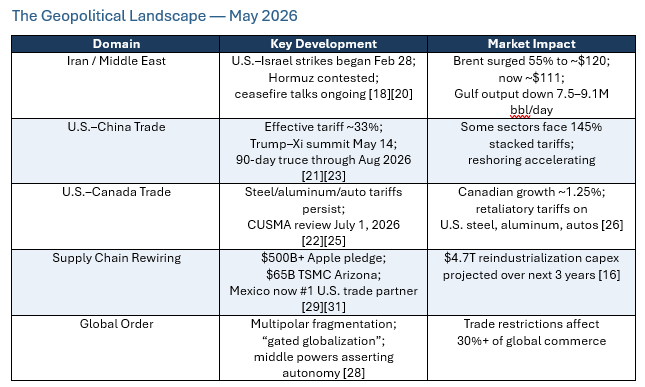
The U.S.-Israeli military campaign against Iran, which began on February 28, has been the most significant geopolitical shock to energy markets since the Russia-Ukraine war—and arguably the largest oil supply disruption in market history. 18
- Oil spike: Brent crude surged more than 55%—from ~$72/barrel to nearly $120-in a matter of weeks as fears over the Strait of Hormuz escalated. 18
- Historic disruption: March 2026 saw one of the largest single-month oil price jumps on record. Gulf states shut in an estimated 7.5–9.1 million barrels per day. 18 19
- Ripple effects: The Strait of Hormuz- which handles roughly 20% of the world’s petroleum and LNG – has been functionally contested for the past two months. Asia is already seeing double-digit price increases in fertilizer, chemicals, and plastics. 16 18
- Where we are now: As of today, President Donald Trump has paused planned strikes, citing “serious negotiations” – but Tehran hasn’t budged, and the Strait remains contested. 20
The lesson is simple and sobering: in a multipolar world, energy security is national security. And disruption is always one headline away. Industrial power requires power sources to be close to home. The US will need and want Canada’s power.
The trade war: Here to stay
If Iran is the acute shock, the U.S.–China trade war is the chronic condition. And it’s not going away.
The effective U.S. tariff on Chinese imports now averages about 33%, stacked across four different policy layers. For some sectors, EVs, batteries, solar, the combined rate exceeds 145%. 21
But it’s not just a China story:
- A 10% global import surcharge has been in effect since February, after the Supreme Court struck down the original IEEPA tariffs. 22
- Steel and aluminum tariffs were doubled to 50% last year. Copper followed. Semiconductors were added in January. 22
- Trump visited Beijing on May 14-the first sitting U.S. president to do so in nearly a decade. The talks produced a temporary easing, but the fundamental tensions are unresolved. 23
- The USTR’s 2026 agenda explicitly prioritizes reshoring, domestic production, and a shift “toward a production economy.” 24
Bottom line: tariffs and industrial policy are now permanent features of the economic landscape. Both parties support them in different forms. Companies and portfolios need to treat them that way. In other words, this transactional way of doing business is becoming the new normal.
Canada at the crossroads
- Canada maintains 25% retaliatory tariffs on U.S. steel, aluminum, and automobiles. 22 25
- The CUSMA review hits on July 1, 2026 – and the outcome could reshape North American trade for the next decade. 22
- The Bank of Canada has acknowledged that U.S. tariffs are “disrupting the Canadian economy,” with growth expected to stay stuck around 1.25%. 26
- We do have leverage – crude oil, critical minerals, and pension fund investment – but let’s be honest: 76% of our goods exports go south. Only 17% of theirs come north. The asymmetry is real. 27
“Coalitions grounded in legitimacy, resilience, and consistency rather than blind faith in multilateral institutions.” -Prime Minister Mark Carney, Davos 2026 28
For Canadian portfolios, the takeaway is twofold: diversification beyond North America is no longer optional, and leaning into Canada’s strategic strengths- energy, minerals, financials – matters more than ever. This theme makes us bullish on many Canadian sectors for investment.
The great rewiring: “Just-in-time” Is dead
All these forces – conflict, tariffs, fragmentation -are driving the most significant restructuring of global supply chains in a generation. These changes should not be ignored.
- Apple has pledged $500 billion in U.S. investment. TSMC is building a $65 billion chip fab in Arizona. J&J is putting $55 billion into domestic pharma production. 29
- 75% of U.S. manufacturers report a positive outlook – the highest since 2023. 30
- Mexico has overtaken China as the top U.S. trading partner. Over 80% of large manufacturers plan to bring supply chains closer to home 31 (I have to be honest, I was surprised by this statistic originally! )
- Cumulative reindustrialization investment across Europe and the U.S. is projected to hit $4.7 trillion over the next three years. 16
“Global supply chains face a new operating reality – one defined by persistent volatility and disruptions embedded in the global economy.” – World Economic Forum, Global Value Chains Outlook 2026 32
Powering the next economy
So, how can we tie this all together? Because whether you’re looking at AI, geopolitics, or industrial policy – it all comes back to one word: power.
The Iran conflict has made the case in real time: energy isn’t just a commodity anymore. It’s a strategic asset. At the same time, the AI revolution is creating an unprecedented surge in electricity demand. Global data center power consumption is expected to more than double by 2030, with AI workloads driving much of this growth.
The world needs:
- More raw energy – oil, natural gas, nuclear – to fuel both traditional industry and the explosive growth of data centers
- Expanded electrical grids – to move power from where it’s generated to where it’s needed, often in entirely new locations
- Modernized infrastructure – pipelines, transmission systems, storage – much of which has been starved of investment for decades
As a great childhood hero of mine once said:
“I gotta have more power, Scotty!”
– Captain Kirk, Star Trek: The Original Series (CBS/Paramount, 1966–1969)
Kirk was right. And I’d argue the global economy is having its Kirk-to-Scotty moment right now.
These are the implications for investment:
Key Beneficiaries
- Commodities: Copper is the essential metal of electrification – wiring data centers, EV networks, and grid expansion. Uranium is being structurally re-rated as nuclear emerges as the only scalable, carbon-free baseload power source that can meet AI-driven demand.
- Infrastructure: Grid modernization, energy transport, and industrial build-out represent a multi-decade investment cycle. The U.S. alone needs an estimated $2.5 trillion in grid upgrades over the next 15 years.
- Financials: U.S. and Canadian banks are positioned to finance this entire “rebuild—energy, industry, infrastructure. Capital-intensive expansion requires capital-intensive financing, and banks have played this role in every major economic transformation. This one is no different.
AI and the semiconductor surge
The AI buildout isn’t just about software. It requires multiple layers of physical computing infrastructure—and each one represents a distinct investment opportunity:
- High-performance GPUs (Nvidia being the obvious example)-the picks and shovels of the AI revolution
- CPU processing power-for inference, orchestration, and hybrid workloads
- Memory and storage-as models get larger and datasets grow exponentially
- Data center infrastructure-cooling, power distribution, networking, physical facilities
This multi-layered demand explains why the semiconductor sector has re-rated so dramatically and we’ve seen some of these companies experience parabolic price increases recently.
The big question: Which companies—and which countries—ultimately capture the value? The TSMC Arizona expansion, Intel’s domestic foundry push, Samsung’s planned Texas facility – they all reflect a global race for semiconductor sovereignty. This is exactly where active management, jurisdictional diversification, and careful stock selection earn their keep.
What to do about it
Theory is nice. Using this theory in practice is the key. Here’s how we’re thinking about portfolios in this environment:
- Selective AI exposure-we want companies with demonstrated revenue and real competitive advantages, not just narrative momentum (not just good podcasts in other words!)
- Real assets and scarce resources-energy, critical minerals, and infrastructure assets that benefit from both the AI buildout and geopolitical reshoring
- Regional diversification-as trade fragments, being concentrated in any single geography is an uncompensated risk
- Quality first-balance sheet strength, pricing power, and durable earnings matter more than ever in a volatile, inflationary world
- Geopolitics as a permanent input-trade policy volatility, supply chain risk, and energy security aren’t tail risks anymore. They’re core portfolio considerations
The U.S. remains the most likely destination for global capital-the innovation ecosystem, capital markets depth, and policy incentives are hard to match. But the margin of dominance is narrowing, and selective global diversification is increasingly wise.
Bottom line
Transformations are messy. Markets will overshoot. Narratives will shift. Volatility will stick around.
But the convergence of technological revolution, geopolitical realignment, and industrial rebuilding points to something bigger than a market cycle. We believe we’re in the early innings of a generational shift-and we’re positioning accordingly.
Our portfolios are built to be:
- Resilient when things get bumpy
- Positioned for the structural growth that’s unfolding
- Flexible enough to adapt as the world keeps changing
The future belongs to the prepared. That’s exactly where we intend to keep you.
Have a great weekend,
Drew Henderson
────────────────────────────────────────────────────────────
Sources
1 YCharts, “S&P 500 Shiller CAPE Ratio (Monthly),” May 2026. Value: 39.58. https://ycharts.com/indicators/cyclically_adjusted_pe_ratio
2 Finanzapedia, “S&P 500 CAPE Ratio (Shiller PE),” May 2026. Historical max: 44.19 (Dec 1999). https://finanzapedia.com/en/sp500/sp500-cape-ratio
3 Westmount Fundamentals, “S&P 500 Top 10 Stocks by Weight 2026,” March 2026 (37.34%). Also: Art of Truth, “S&P 500 Market Concentration: 10 Stocks Make Up 41%,” May 18, 2026. Also: The Economic Times, “AI stocks surge to 45% of S&P 500,” Apr 24, 2026 (Goldman Sachs data).
4 CNBC, “Tech AI spending approaches $700 billion in 2026,” Feb 6, 2026. Also: Futurum Group, “AI Capex 2026: The $690B Infrastructure Sprint,” Feb 12, 2026. Also: European Business Magazine, “Big Tech AI Capex 2026: $725B,” Apr 30, 2026.
5 David Cahn, “AI’s $600B Question,” Sequoia Capital, June 20, 2024. https://www.sequoiacap.com/article/ais-600b-question/
6 Deutsche Bank Global Markets Survey, Dec 2025, via Investing.com, “AI valuation crash is the biggest market risk in 2026,” Dec 18, 2025. 440 respondents; 57% cited AI/tech bubble as top risk. Strategist: Jim Reid.
7 Red Lotus Capital, “Historical Analysis of the US Stock Market’s Dot-Com Bubble Era (1995–Early 2000),” Medium, Nov 2, 2025. Notes: 14% of IPO tech firms profitable at peak; Nasdaq-100 forward P/E of 60.1×.
8 Nvidia Newsroom, “NVIDIA Announces Financial Results for Fourth Quarter and Fiscal 2025,” Feb 26, 2025. FY2025: Revenue $130.5B (+114% YoY), Net Income $72.9B (+145%), Free Cash Flow $60.9B. Also: Monexa.ai, “NVIDIA FY2025 Financial Deep Dive.”
9 MacroMicro, “US – S&P 500 – Forward PE Ratio,” May 19, 2026 (20.88). Also: Trendonify (22.1). Also: StreetStats (20.72). Also: VCP Scanner (23.2). Range reflects source variation; ~21× used as central estimate.
10 MacroMicro, “US – NASDAQ 100 Index – Forward PE Ratio,” May 2026 (24.15). Also: VCP Scanner (26.4, trailing-based forward). ~24× used as central estimate.
11 Alphabet Q1 2026 Earnings Release, Apr 29, 2026. Google Cloud revenue: $20.03B, +63% YoY. Operating income: $6.6B, +203% YoY. Also: CNBC, Quartz, CRN coverage of same date.
12 Microsoft Q3 FY2026 Earnings Release, “Microsoft Cloud and AI strength fuels third quarter results,” Apr 29, 2026. AI business annual revenue run rate: $37B, +123% YoY. Revenue: $82.9B, +18%. Cloud revenue: $54.5B, +29%. CEO Satya Nadella quote.
13 Amazon Q1 2026 Earnings Release, “Amazon.com Announces First Quarter Results,” Apr 29, 2026. AWS revenue: $37.6B, +28% YoY — fastest growth in 15 quarters. CEO Andy Jassy quote. Also: CNBC, Quartz, Yahoo Finance, Zacks coverage.
14 SEC.gov, “Initial Public Offerings (IPOs) – Statistics,” 2025 annual data: 374 total IPOs. For 1999 comparison (~477 IPOs): multiple historical sources including Red Lotus Capital [7] and Goldman Sachs history. Also: Stout, “IPO Trends: A Resilient 2025 and a Constructive 2026,” Feb 6, 2026 (347 corporate IPOs). Also: EY, “US IPO market trends” (216 deals >$50M).
15 Goldman Sachs Research via Yahoo Finance, “Goldman finds median ~30% productivity boost for 2 specific AI use cases,” Mar 3, 2026. Also: BCG/Harvard “Jagged Frontier” study (758 consultants: 25% faster, 40% higher quality within AI capability boundary), via Forbes, “AI Productivity’s $4 Trillion Question,” Jan 20, 2026. Also: McKinsey, “The economic potential of generative AI,” June 2023 ($2.6–$4.4T annual value potential).
16 Morgan Stanley Institute, April 2026. Geopolitics as structural market force; $4.7T reindustrialization capex projection; supply chain and energy disruption analysis.
17 JPMorgan Chase International Council, September 2025. “The world is not collapsing — it is being rewired.”
18 Multiple sources on Iran/oil disruption: Brent crude surge of 55% from ~$72 to ~$120 (Feb–Mar 2026); Gulf output reduction of 7.5–9.1M bbl/day; Strait of Hormuz handles ~20% of global petroleum/LNG.
19 Gulf state oil production shut-in estimates. Various energy market analysts and reporting, March 2026.
20 Reporting on Trump administration pause of Iran strikes, citing “serious negotiations,” May 2026.
21 U.S.–China tariff analysis: effective average ~33% across MFN base, Section 301, IEEPA fentanyl, and reciprocal tariff layers. Some sectors (EVs, batteries, solar) exceed 145%.
22 U.S. trade policy actions: 10% Section 122 global surcharge (Feb 24, 2026); steel/aluminum tariffs doubled to 50% (June 2025); copper tariffs (Aug 2025); semiconductor tariffs (Jan 2026). Canada retaliatory tariffs of 25%. CUSMA review July 1, 2026.
23 Trump–Xi Beijing summit, May 14, 2026. First sitting U.S. president visit to China in nearly a decade. Temporary tariff reduction; fundamental tensions unresolved.
24 USTR 2026 Trade Policy Agenda. Priorities: domestic production, reshoring critical supply chains, shift “toward a production economy.”
25 Canada retaliatory tariffs on U.S. steel, aluminum, and automobiles at 25%.
26 Bank of Canada, January 2026 Monetary Policy Report. Canadian growth projection ~1.25%.
27 Canada–U.S. trade asymmetry: 76% of Canadian goods exports to U.S.; 17% of U.S. goods exports to Canada.
28 PM Mark Carney, Davos 2026. Trade restrictions affect 30%+ of global commerce. Call for coalitions based on “legitimacy, resilience, and consistency.”
29 Corporate reshoring commitments: Apple $500B+ U.S. investment; TSMC $65B Arizona chip fab; Johnson & Johnson $55B domestic pharma production.
30 U.S. manufacturing sentiment: 75.3% of manufacturers report positive outlook; sales/production projected +3.5–3.8% over 12 months — highest since 2023.
31 Mexico surpassed China as top U.S. trading partner. 80%+ of large manufacturers plan nearshoring. McKinsey, “Three forces reshaping manufacturing footprints,” 2026.
32 World Economic Forum, Global Value Chains Outlook 2026. “Persistent volatility and disruptions embedded in the global economy.”
────────────────────────────────────────────────────────────
Important Disclosures
This commentary is provided for informational and educational purposes only and does not constitute personalized investment advice, a solicitation, or an offer to buy or sell any security. The views expressed herein reflect the opinions of the author as of the date of publication (May 19, 2026) and are subject to change without notice based on market and other conditions. Past performance is not indicative of future results. All investments involve risk, including the possible loss of principal. Specific companies, sectors, and securities are mentioned for illustrative purposes only and should not be construed as recommendations to buy, hold, or sell. Forward-looking statements are based on current expectations and assumptions and are not guarantees of future performance. Actual results may differ materially from those expressed or implied. Clients should consult with their financial advisor to determine the suitability of any investment strategy based on their individual circumstances, objectives, and risk tolerance. This material may not be reproduced or distributed without the prior written consent of the author.