Half Full or Half Empty?
How do you view the glass — half full or half empty? This question aptly captures the dual nature of sentiment today. On one hand, our standard of living is among the highest in history, fuelled by technological advances, improved quality of life, substantial and growing wealth and increased life expectancy. On the other hand, this progress is overshadowed by rising costs of living, heavy debt burdens, declining productivity and ongoing geopolitical tensions.
Economies similarly continue to navigate between two contrasting states, described by some as a “delayed landing.” Despite predictions for a recession since 2022, the economic news has largely persisted in a space that could be viewed as either half full or half empty.
Given this context, it is perhaps unsurprising that markets remained unusually calm during the first half of 2024. In July, the CBOE Volatility Index (VIX) lingered at lows not seen since November 2019, and the S&P 500 experienced its longest daily stretch without a two-percent drop since 2007.1 Yet, this tranquility was interrupted by the Bank of Japan’s unexpected interest rate hike. A rapidly appreciating Japanese yen and the unwinding of a risky leveraged strategy known as the “carry trade” prompted the Nikkei to its worst day since Black Monday in 1987. This marked the return of volatility for North American markets, with the VIX spiking to the third-highest level since its inception, showing just how quickly sentiment can shift.
While a sense of uncertainty reemerged, the near-term outlook hadn’t dramatically changed: global inflation continues to fall, labour markets, while slowing, remain stable on an absolute basis, corporate earnings have been robust and financial conditions remain relatively loose.
In the preceding calm, we may have forgotten that volatility is a common feature of the markets — often indiscriminate in nature. Over the past 40 years of the S&P/TSX Composite Index, a 5 percent downturn is pretty much guaranteed in most years. A double-digit drawdown occurs every 1.8 years and a drawdown of more than 15 percent happens one-third of the time. Even in years where the S&P/TSX Composite Index has posted strong annual performance, significant intra-year price drawdowns are common. The stock market goes down even when it goes up. The average intra-year drawdown over 40 years is -15 percent, despite an average annual return of more than 6 percent (see page 3).
During these times, it’s important not to let short-term fluctuations disrupt long-term financial plans. Worth repeating: One of the most important variables for how you’ll do as an investor is how long you can stay invested. The inevitable market swings will put investors to the test, but this is the price of admission for the longer-term gains that equity markets offer. Consider the merits of having a solid investment plan — and sticking to it.
As fall ushers in the Thanksgiving season, we would like to take the opportunity to express gratitude to those of you who have introduced us to friends and family seeking fresh perspectives, who can benefit from our experience, support and advice. We continue to welcome new clients and sincerely appreciate you, our existing clients, for your continued confidence in our services. Wishing you the many ‘bounties of the season.’
1. https://bnnbloomberg.ca/business/company-news/2024/07/24/sp-500-snaps-longest-streak-without-a-2-decline-since-2007/
IT’S BACK-TO-SCHOOL TIME…
The RESP: Would You Turn Down “Free Money”?
There are many reasons to consider a Registered Education Savings Plan (RESP) to save for a child’s future education: tax-deferred growth within the plan, earnings taxed at the child’s tax rate when eventually withdrawn and, of course, the Canada Education Savings Grant (CESG). The CESG consists of funds paid into the plan by the federal government as a 20 percent matching grant, to an annual maximum of $500 ($1,000 if there’s unused grant room from a previous year) and a lifetime maximum of $7,200 per beneficiary. There are no annual limits on RESP contributions, however the lifetime limit is $50,000.
Conventional wisdom suggests we should take advantage of the CESG — after all, it’s essentially ‘free’ money. But is this always the best decision? One way to maximize the CESG involves contributing $2,500 per year over 15 years to receive the full $7,200 in grants. However, will this achieve the greatest outcome for the RESP?
To answer this question, let’s compare Investor 1, who gradually contributes and maximizes the CESG, and Investor 2, who contributes a lump sum amount and doesn’t maximize the CESG. The outcome may be surprising. Both investors are assumed to earn an annual rate of return of 5 percent. Investor 1 contributes $2,500 each year starting in the first year of the child’s life until year 20, to a maximum contribution of $50,000, and receives the full $7,200 CESG grant. After 20 years,
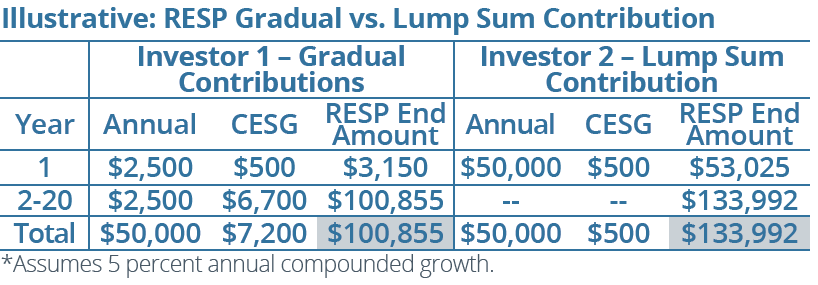
the RESP produces $43,655 of growth, resulting in a value of $100,855. Investor 2 contributes a lump sum of $50,000 — the full RESP limit — in the first year of the child’s life, so the RESP receives only $500 of CESGs. Yet, the RESP grows to $133,992 over the same period.
This shows the profound impact of compounding over time. Front loading the initial contribution yields a larger outcome, even without receiving the full CESG, all else being equal. Despite lower total contributions (funds paid into the plan plus CESGs) for Investor 2, or $6,700 less in CESGs, the outcome is $33,137 greater.
A Lesson for the RESP — And Investing in General
Of course, not many investors have $50,000 of discretionary funds at the start of a child’s life. As such, maximizing the CESG where possible is a prudent strategy. Yet, this example illustrates why, as advisors, we often remind investors not to overlook the impact that compounding can have over time on any investment — not just the RESP. One takeaway? The sooner you start, the more time funds have to grow and, when it comes to growth, the larger the initial investment, the better!
When was the last time you reviewed account beneficiaries?
A recent article in the Wall Street Journal is a reminder:
“His Ex Is Getting His $1 Million Retirement Account. They Broke Up in 1989.” Before year end, consider reviewing account beneficiaries, especially if you’ve left a job or had changing life circumstances. If you need assistance with investment accounts, please call.
SURPRISING TFSA STATISTICS
Are You Overlooking the Tax-Free Opportunity?
There are few “gifts” that the government gives us, and the Tax-Free Savings Account (TFSA) is one of them. The opportunity to invest and grow funds on a tax-free basis over a lifetime should not be overlooked.
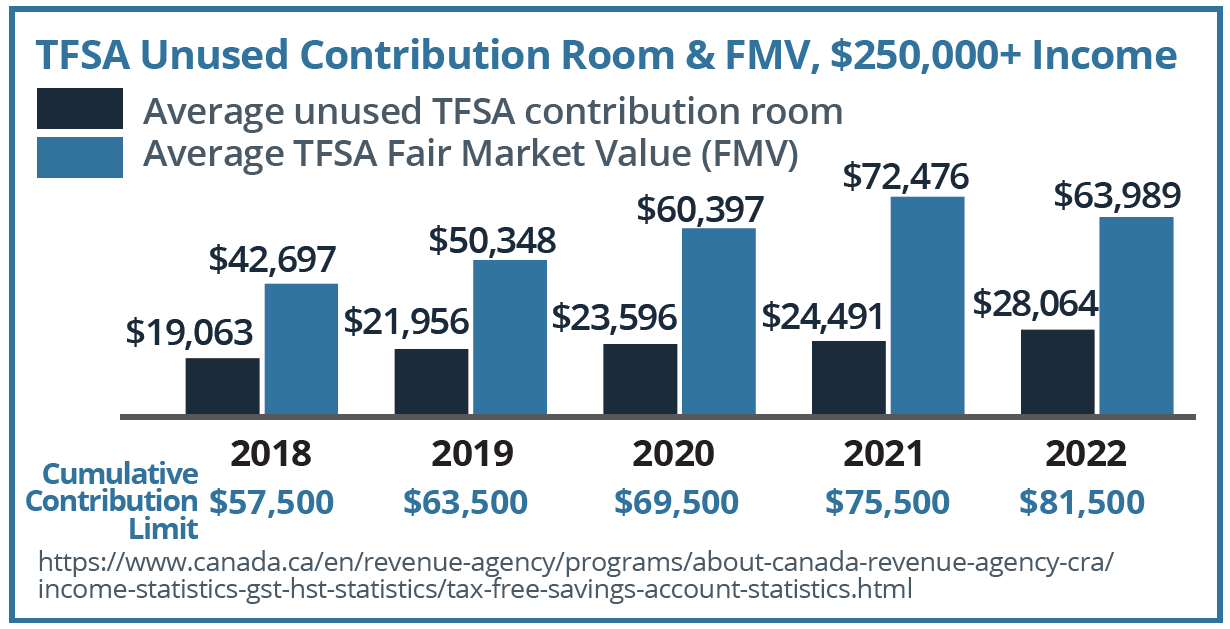
Yet, the latest statistics reveal that many high-net-worth (HNW) individuals are not taking full advantage. The 2024 TFSA statistics (for the 2022 tax year) were recently released and are surprising. For HNW taxpayers with incomes over $250,000, around 35 percent of average contribution room remains unused. While many of us gripe about higher taxes, we certainly aren’t doing a great job of maximizing tax-advantaged accounts. As well, the average fair market value (FMV) remains below the cumulative contribution limit. An investor who invested the full annual dollar amount since the TFSA’s inception could have over $145,000, assuming a rate of return of 5 percent each year.
What’s causing these shortfalls? Several factors might be at play. When the TFSA was introduced in 2009, it was often misunderstood as merely a ‘savings account,’ leading some investors to miss out on its growth potential. Others continue to view the TFSA as a short-term tool, withdrawing funds for immediate expenses rather than letting them grow. However, the opportunity cost is significant. Consider an investor who contributes the 2024 cumulative contribution limit of $95,000, plus $7,000 annually at a 5 percent rate of return over 25 years. This would accumulate to almost $650,000 in funds that could be withdrawn and
used completely tax free! Yet, this assumes that contributions and investment gains are left untouched in the TFSA, allowing for growth.
Another factor may be that some investors have taken a more risky approach with their TFSA investments. This may be harmful for two reasons. If an investment realizes a substantial loss, that contribution room is lost forever. And, there is no tax relief. Unlike a non-registered account, TFSA losses cannot be claimed on an income tax return.
How about you? Are you fully maximizing your TFSA? Don’t overlook the potential for significant future tax-free growth. Call for assistance.
VOLATILITY: A COMMON FEATURE OF THE MARKETS
Even the Good Years Have Down Times
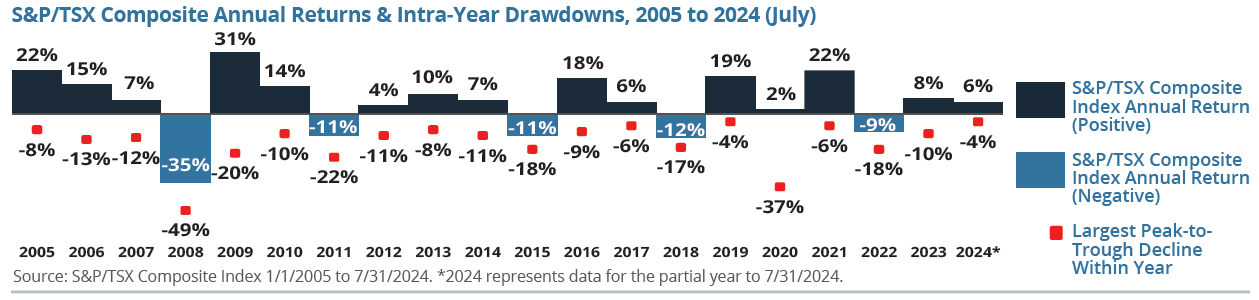
While many aspects of investing in the equity markets may seem unpredictable, one constant remains: volatility. Just how common are market fluctuations? Even in years when the S&P/TSX Composite Index has performed well, we should expect substantial volatility. Over the past 40 years, despite average annual performance of more than 6 percent, the average intra-year decline was -15 percent (see graph below for performance since 2005), with corrections of 10 percent or more occurring more than half of the time and drawdowns of 15 percent or more occurring one-third of the time!
Successful investing involves being prepared for both the market ups and inevitable downs. While it’s never easy to see portfolio values decline during temporary down periods, patience and perspective are important. Don’t let short-term fluctuations disrupt long-term financial plans.
FINAL MONTHS OF THE YEAR
The FHSA Carryforward Rules & More…
The final months of the calendar year are a time when tax strategies are often top of mind. As a reminder, the tax rules allow you to carry forward certain tax credits or deductions not used in the current year.
Be aware that the carryforward rules differ among registered plans. The introduction of the First Home Savings Account (FHSA) has been a source of some confusion. For the FHSA, an account holder can contribute $8,000 in annual participation room. Unused amounts can be carried forward to the following year, but only to a maximum of $8,000 and subject to a lifetime limit of $40,000. In contrast, for the TFSA and RRSP, unused contribution room can be carried forward indefinitely (or until age 71 for the RRSP). This is important because the CRA imposes a penalty of one percent per month on excess contributions. Since the FHSA closes at the end of the year of its 15th anniversary or the year after the first qualifying withdrawal, not contributing the full $8,000 each year could mean missing out on the lifetime limit and its tax-deductible benefits. Not maximizing contributions early also reduces potential tax-free growth.
As you plan before year end, here are some other carryforward rules:
Capital Losses — If investments held in non-registered accounts are sold for less than their original cost, the capital loss can be used to offset capital gains realized during the year. If you don’t have sufficient capital gains, the net capital loss can be carried back three taxation years, or carried forward indefinitely to use against net capital gains. Tip: Be aware of the superficial loss rules, which may deny the loss if you or an affiliated entity acquires the same security 30 days before/after the date of the loss transaction.
Registered Retirement Savings Plan (RRSP) — Both unused RRSP contribution room and unused RRSP deductions may be carried forward. Tip: You don’t have to wait for the March 3, 2025, deadline to make contributions. Contributing as early as possible can allow for greater tax-deferred growth. Deferring the deduction may also provide tax-planning opportunities. For instance, if you make a contribution, you can delay the RRSP deduction to a future year, perhaps one in which you have a relatively higher income to offset the higher potential tax.
TFSA — Unused TFSA contribution room can be carried forward indefinitely. Tip: If you need TFSA funds, consider withdrawing before year end. Contribution room resets itself at the start of the calendar year, so withdrawing after Dec. 31, 2024, would mean that this contribution room will not be available until Jan. 1, 2026.
RESP — For the CESG (see page 2) there are carryforward limits. While the 20 percent matching grant is capped at an annual maximum of $500, unused grant room from a previous year can carry forward to
a maximum of $1,000 in grants per year ($500 current year + $500 carryforward). Tip: If you haven’t contributed in a prior year, consider a contribution of $5,000 to achieve the maximum grant.
Charitable Donations — Donations not used in the current year can be carried forward for five taxation years. This may be useful for donations made to U.S. charities, as these generally can only be claimed against U.S. source income earned in the year the credit is claimed. Tip: If you donate shares “in kind” to an eligible charity, you receive a donation receipt for the fair market value of the shares. For shares in a non-registered account that have appreciated in value, the donation may also eliminate the tax liability on the capital gains triggered.
Medical Expenses — While medical expenses cannot be carried forward, you can claim eligible expenses for any 12-month period ending in the current taxation year. Tip: If medical expenses do not otherwise exceed the minimum threshold to claim the tax credit in a calendar year, consider choosing a 12-month period that extends into a different calendar year, i.e., if material expenses were incurred from June 1, 2023, to December 31, 2023, the 12-month period of June 1, 2023, to May 31, 2024, would be available to claim the tax credit for the 2024 tax year.
Current Events:
Four Perspectives on the U.S. Election & Investing
Politics and money are never far apart. Election years frequently bring about questions surrounding changes to public policies, potential regulatory shifts and the ensuing effects on the markets and economy. This year’s U.S. election has been no exception, with investors keeping a close eye on possible changes that could influence industries, sectors and the overall economic landscape. However, while public policy undoubtedly plays a role in shaping specific industries, sectors and even the broader economic and social climate, its actual impact on investment outcomes may not be as pronounced as some might believe. Here are four perspectives:
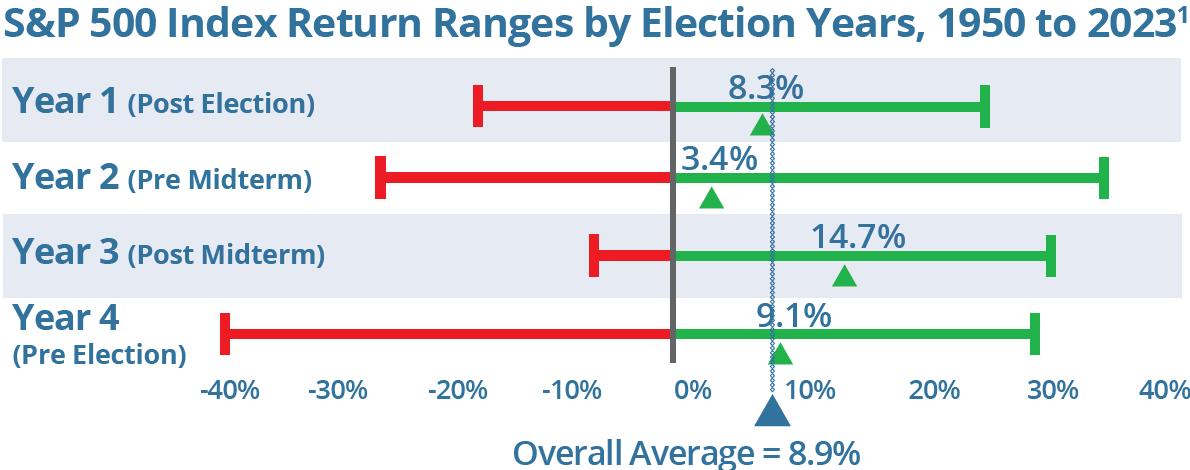
1. The U.S. presidential election is not a notably “market-changing event.” While the markets tend to perform positively in election years, some investors have suggested that this upward trend is due to the party in power encouraging the markets to improve the chances of getting re-elected. However, historical data shows that election-year market performance doesn’t differ significantly from the overall average market performance. Since 1950, the S&P 500 Index has averaged a return of 9.1 percent in an election year (indicated by “Year 4” in the chart below), compared to the overall market average of 8.9 percent during this time. One interesting observation is that the 12 months preceding an election have exhibited the widest range of market outcomes compared to other times in the election cycle.
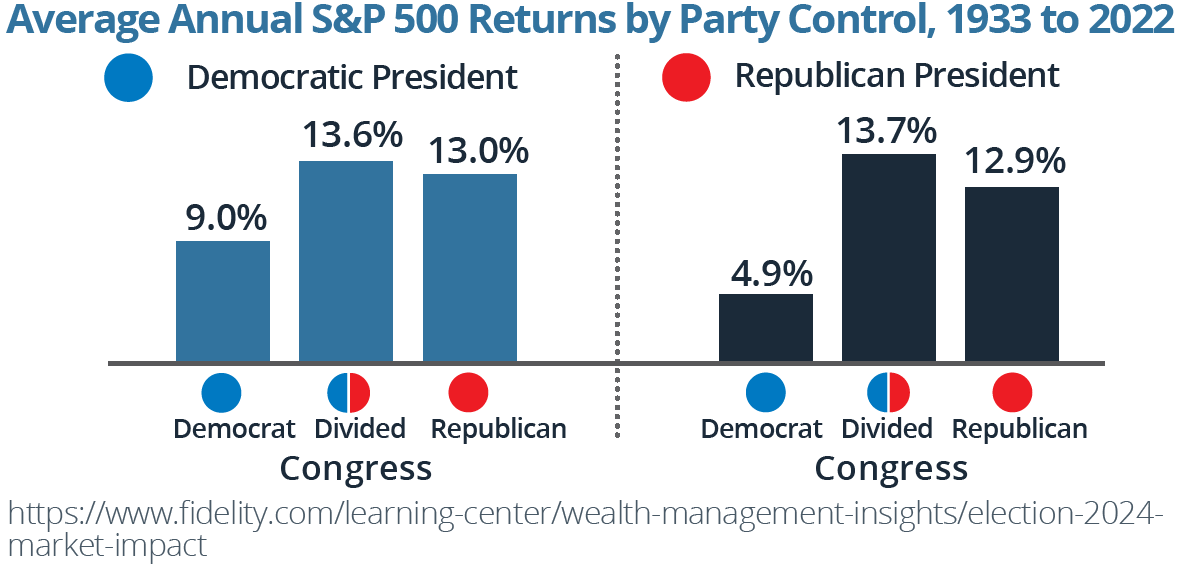
2. There isn’t a strong relationship between election-day outcomes and how markets perform thereafter. While some investors assert that one political party may be better for market returns, historical data does not support this theory. Since 1933, the S&P 500 has historically averaged positive returns under every partisan combination and there is no clear trend that relates to political party power: markets appear to be non-partisan. In fact, a divided government has been correlated with the strongest market returns — some have suggested that this is because government gridlock may create less policy uncertainty (see graph, top right).
3. Predicting potential policy impacts, at this stage, carries risks. While it is possible to anticipate potential policy impacts from a high level, making changes to investment programs based on campaign promises is not advised. This is supported by historical data on sector performance which suggests very few consistent patterns of relative sector returns in election years.2 Of course, many investors are watching carefully to see how potential policy changes could impact the markets, sectors or even a company’s performance. However, consider that campaign promises do not always result in policy changes. The success of these policies may also depend on a variety of factors, including the composition of Congress or the Senate, economic and social conditions and many others.
4. Consider sticking to your plan and making adjustments based on thoughtful analysis. During presidential election years, election-year uncertainty and media headlines can often spark market volatility, prompting some investors to consider making adjustments to their investing strategies. While the buzz surrounding elections is often hard to ignore, consider the merits of staying focused on long-term goals rather than getting caught up in the short-term noise. Once the elected party takes power, adjustments can be made based on formal policy changes and thoughtful analyses. Reacting to the immediate outcomes of an election is rarely beneficial from an investing perspective. Instead, a disciplined approach and a well-crafted investment plan should remain the cornerstones of your strategy, no matter which way the political winds may blow this November.
1. https://www.fidelity.com/learning-center/wealth-management-insights/election-2024-market-impact; 2. https://www.fidelity.com/learning-center/trading-investing/election-market-impact