A Bifurcation in Sentiment
Markets rarely linger in equilibrium. The pendulum of sentiment swings between fear and greed, and this year has been no exception. After April’s lows, the S&P surged over 30 percent in just two months, one of the fastest rallies in recent history, while the TSX hit multiple all-time highs.
Yet, the mood among investors remained divided. The summer enthusiasm saw a return of speculative fervour: meme stocks and cryptocurrencies (consider that Fartcoin reached a market cap of $1 billion). Many younger investors, who came of age during the low-rate post-pandemic era (and notably have never experienced a prolonged bear market), leaned into the euphoria. More seasoned investors, meanwhile, appeared to be climbing the proverbial “wall of worry,” mindful of cycles past.
One driver has been the substantial optimism over artificial intelligence (AI). In the first half of 2025, AI capital expenditures contributed more to U.S. GDP growth than consumer spending.1 This has prompted some analysts to ask: Would the U.S. economy have contracted without this massive spend? The top four tech firms alone are on track to spend $344 billion in AI capex this year—about one percent of total U.S. GDP.2
Indeed, the excitement pushed valuations to elevated levels. By summer’s end, the S&P 500 traded at 22.0x forward earnings; well above its long-term average of 16.7x, with the top 10 stocks at 28.8x.3 The S&P/TSX sat lower at 17.0x, reflecting Canada’s heavier weighting in value-oriented sectors like energy and financials.
Are we approaching bubble territory? At the height of the dot-com boom, the S&P 500 had a forward P/E of 24.2x, but many stocks traded much higher: Cisco at 200x and Microsoft at 73x! In the late 1990s, simply adding “.com” to a company’s name could send valuations soaring. Today’s tech leaders are different: profitable, diversified, generating substantial cash flow and leaders in innovation. During the bubble of the “Nifty Fifty” era in the 1960s and 1970s, Polaroid traded at 90x earnings, yet investors still justified such multiples for “one-decision” stocks—buy and never sell.4
Today’s extended valuations may be viewed through several lenses. Lower interest rates increase the present value of future cash flows. Higher multiples are often justified for high-growth sectors like technology, when innovation and productivity gains are expected to persist. Supply/demand dynamics have also shifted: the number of U.S. publicly-listed companies has shrunk by half from its peak of 8,000 in 1996, while retail participation has surged: 62 percent of U.S. households own stocks, up from less than 40 percent in 1990.5 And, of course, investor euphoria has fuelled gains.
While momentum can carry further than many anticipate, fundamentals eventually reassert themselves. Earnings growth and return on capital, among others, drive long-term performance, even when short-term dislocations occur. Elevated valuations can reduce upside potential if prices already reflect optimistic outcomes, and amplify downside risk should expectations falter. The price you pay remains important to achieving strong long-term outcomes. Valuations may not forecast short-term movements, but they remain a dependable compass, helping investors steer between the twin forces of fear and greed.
As the cooler days approach, it is a reminder that the end of the year will be here before we know it. If you need assistance with any investing matters in these final months of 2025 (see pg. 3, in brief), please call the office. This Thanksgiving season and beyond, we remain grateful for your trust and wish you a lovely fall.
- https://fortune.com/2025/08/06/data-center-artificial-intelligence-bubble-consumer-spending-economy/
- https://financialpost.com/news/big-techs-big-bet-ai-driving-spending
- At 6/30/25. https://am.jpmorgan.com/content/dam/jpm-am-aem/global/en/insights/market-insights/guide-to-the-markets/mi-guide-to-the-markets-us.pdf
- Nifty Fifty: A group of 50 NYSE large-cap stocks. https://awealthofcommonsense.com/2020/07/the-nifty-fifty-and-the-old-normal/
- https://www.axios.com/2023/10/18/percentage-americans-own-stock-market-investing
wealth perspectives
Food For Thought: We’ve Never Been Wealthier
Canadians are wealthier than ever. The latest statistics show that average household net worth reached $1.03 million last year and continued to rise. Total wealth has grown by 30 percent since 2019, with Millennial and Gen X wealth climbing by over 10 percent in 2024.1
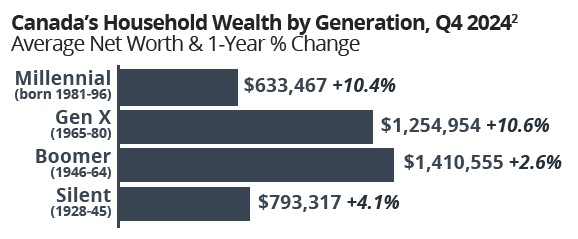
Despite facing one of the toughest job markets in decades and a difficult path to homeownership, Gen Z (born 1997 to 2012) is doing just fine. At the same age, Gen Z incomes are 50 percent higher than Boomers’, according to The Economist. By comparison, Gen X incomes were only 16 percent higher than Boomers’ at the same age—the smallest gain of any group, likely due to a weak labour market after the Global Financial Crisis.2 Gen Z is also saving better, contributing a greater share to retirement plans than Millennials did when entering the workforce. In 2023, the median RRSP contribution for those under 25 was more than 20 percent higher than Millennials in 2009.3
Yet, despite rising wealth across every generation, many don’t feel wealthy. Higher living costs have strained households, while constant connectivity makes it easy for some to feel like they’re falling behind the Joneses. Wealth can be a slippery benchmark—it often feels like it’s never quite enough. Research shows that people quickly adapt. While incremental increases provide a temporary boost in satisfaction, expectations quickly reset. In one survey, 19 percent of people with a net worth of at least US$500,000 said that ‘having enough money’ was a constant worry. Yet, among those with a net worth of at least US$10 million, 33 percent felt the same.4
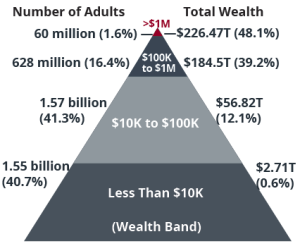
At the end of the day, however, it’s worth remembering: being a millionaire (in USD) puts you in the top 1.6 percent of the wealth pyramid globally.5
The Global Wealth Pyramid2
- https://financialpost.com/wealth/canadian-households-worth-more-million-2024
- https://www.economist.com/finance-and-economics/2024/04/16/generation-z-is-unprecedentedly-rich
- https://www.theglobeandmail.com/investing/personal-finance/retirement/article-retirement-savings-gen-z-canadians/
- “Your Money & Your Brain,” Jason Zweig, pg. 127
- Based on USD. https://www.ubs.com/global/en/wealthmanagement/insights/global-wealth-report.html
artificial intelligence exuberance: how far we’ve come
At a Glance: Perspectives on the Big Tech Bull Market
After a summer of considerable market enthusiasm surrounding artificial intelligence (AI), it’s worth taking a step back.
Why does AI seem to be advancing so quickly? While it may feel like a recent phenomenon, its roots stretch back to the 1950s when Alan Turing proposed his now-famous “Turing Test” for machine intelligence. What’s different today is the pace of progress, driven by exponential increases in computing power, vast datasets and advances in machine learning algorithms. To put it into perspective, in the late 1980s, annual data creation was measured in terabytes (TB). In 2025, global data generation is expected to exceed 180 zettabytes (ZB)—one ZB is a billion times larger than one TB. At the end of the 1980s, one terabyte of storage cost more than $20 million; today, it is well under $100—a mind-blowing decline in just four decades.1
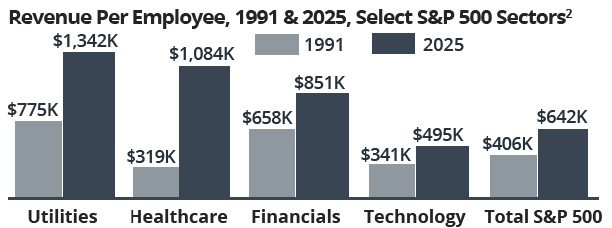
Few doubt that AI will be an economic driver in the years ahead. Technology has long supported productivity gains. Consider how revenue per employee has dramatically increased since 1991 (chart, above), fuelled by computers, the internet, mobile devices, software and the innovation they’ve enabled. However, key questions remain: Will AI live up to its transformative promise, reshaping the world like the steam engine or lightbulb? And, beyond the excitement, who will emerge as the winners?
Concerns persist about the concentration of big tech in the S&P 500, but the reality is more nuanced. Today’s largest tech firms differ from the internet darlings of the late 1990s. The “Magnificent Seven” are cash-generating, innovative and diversified, having acquired over 800 companies and expanding across industries. In many ways, they function as modern tech conglomerates—still growing organically, but supported by multiple engines of innovation.
Ultimately, history reminds us that the successful adoption of any new technology doesn’t guarantee financial success for all early adopters. Thoughtful analysis and evaluation, alongside a diversified approach to balance exposure and keep portfolios resilient as conditions shift, can help investors capture innovation’s upside.
- https://ourworldindata.org/grapher/historical-cost-of-computer-memory-and-storage
- Inflation-adjusted; https://ritholtz.com/2025/08/the-magnificent-493/
Select Large Technology Company Acquisitions2
| IPO Year | # of Acquisitions | Select Acquisitions | |
| Amazon | 1997 | 105 | Whole Foods, MGM |
| 2004 | 270 | YouTube, Wiz | |
| Microsoft | 1986 | 250 | Activision, LinkedIn |
| Apple | 1980 | 100 | Siri, Beats |
A 547% INCREASE?
On the Rising Cost of Education
If you’ve eaten fast food recently, you may be surprised by the bill. More than thirty years ago, a Big Mac hamburger cost around $2. Today, it is almost four times the price. Over the same period, average family income has risen by 162 percent, while the Consumer Price Index (CPI), the official measure of inflation, increased by 140 percent. Yet, among the items compared below (chart), one cost has far outpaced everything else: university tuition.
With the school year now underway, it is a timely reminder to consider education funding. Ensuring our families have the financial means to support higher education is more important than ever, given the rising costs. An investment program is also a great way for parents, grandparents and other family members to leave a legacy.
Registered Education Savings Plan (RESP) — The most common tool, the RESP offers tax-deferred investment growth, Canada Education Savings Grants (CESGs) of up to $7,200 per beneficiary and potential income-splitting when funds are withdrawn and taxed in a beneficiary’s hands.
Formal Trust — Unlike RESPs, there are no contribution limits (RESPs have a $50,000 per beneficiary limit), tax deferral or CESG benefits. However, earnings on trust assets may be taxed in the hands of the trust beneficiary if properly structured so attribution rules do not apply. Be aware that once funds are paid to the beneficiary, they can be used for any purpose, not just education.
Life Insurance — Participating whole life insurance can be structured to accumulate cash value to help cover future education costs. The cash value grows in a tax-advantaged way, and the policy also provides life insurance protection for the beneficiary.
Do You Have a Student in the Family?
If you have a student attending post-secondary school, keeping good records is important to take full advantage of tax benefits. Two tips:
- Tuition Tax Credit — This federal non-refundable credit has been reduced to 14 percent of eligible tuition fees (July 2025), with provincial credits available. After applying the tuition credit to their own taxes, any remaining credit can be transferred to one of the following individuals: spouse/partner, parent or grandparent to a maximum of $5,000 less the amount used by the student. Unused amounts can also be carried forward for use by the student in a future year.
- Moving Expenses — Certain moving costs may be deductible. For example, if a student attends a post-secondary program at least 40 km from home and returns in the summer for a job, these expenses may be deductible for the student on a tax return.
Changes in (Nominal) Prices of Select Items: 1987 & 20251
| 1987 | 2025 | Change | |
| Cdn. Family Income (Avg.)2 | $42,686 | $112,001 | +162% |
| Cdn. House (Avg.)3 | $129,702 | $672,784 | +419% |
| Flat Screen TV4 | $1,599 (32”) | $750 (55”) | -53% |
| Top Apple Computer5 | $9,150 | $8,999 | -2% |
| Microwave4 | $580 (680W) | $300 (1100W) | -48% |
| Bottle of Dom Perignon6 | $85.25 | $351.95 | +313% |
| Big Mac Hamburger7 | $2.05 | $7.81 | +281% |
| University Tuition2 | $1,137 | $7,360 | +547% |
| Consumer Price Index8 | 67.5 | 162 | +140% |
| S&P/TSX Composite Index9 | 3,975.32 | 28,564.50 | +619% |
- 1987 data is nominal data from: Report on Business Magazine, Apr. 2012, pg. 13; 2. https://publications.gc.ca/collections/collection_2018/statcan/13-208/CS13-208-1987.pdf; Stat Can T-1110019101 for 2025, with 3.6% (2024) & 3.8% (2025) wage growth assumptions; 3. Data from CREA; April 1987 and July 2025 data; 4. Average Sony HD TV price based on 32” and 55”, bestbuy.ca; 5. MacPro Tower, apple.ca; 6. LCBO Ontario pricing at July 1987 and July 2025; 7. Economist.com Big Mac Index raw data: https://github.com/TheEconomist/big-mac-data; 8. https://bankofcanada.ca/rates/related/inflation-calculator/ for June 1987 & 2025; 9. At close on 8/27/87 and 8/29/25.
Feel As Though You’re Paying more tax?
In Brief: Tax Planning Before Year-End
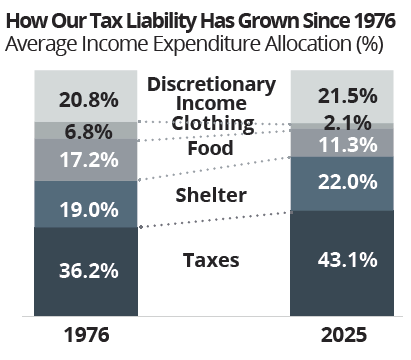
Despite rising living costs, the share of income spent on necessities has declined. In 1976, households spent about 43 percent of their income on shelter, food and clothing. Today, this has fallen to around 35 percent. What has risen is the share we pay to taxes. In 2025, the average Canadian family paid 43.1 percent in taxes.1 Put differently, if taxes were paid upfront, the first 158 days’ earnings would go entirely to the government!
This is why tax planning continues to be an important part of wealth planning. As we approach the final months of the year, here are a handful of actions, in brief, that may help improve your tax position in 2025:
Split income. This may include electing to split eligible pension income with a spouse or paying reasonable salaries to family members for services provided to your self-employed business.
Contribute to your RRSP. You still have 60 days after the calendar year end to make contributions for the 2025 tax year, but the earlier you contribute, the greater opportunity for tax-deferred growth.
Consider tax-loss harvesting. Realize capital losses to offset capital gains. Please contact the office well before the end of the year to enact this strategy to allow for sufficient settlement time.
Give charitably. Gifting publicly-traded securities to a registered charity may offer tax benefits, including eliminating the capital gains tax liability on appreciated securities.
Claim the pension income tax credit. If you are 65 years or older and don’t have eligible pension income, consider opening a small RRIF or purchasing an annuity.
Withdraw from the TFSA before year-end. If you plan to withdraw, consider doing so before the year-end. Contribution room resets at the start of the calendar year, so withdrawals after December 31, 2025, won’t restore contribution room until January 1, 2027.
Make RESP contributions. While it won’t save tax, you may potentially benefit from the CESGs for 2025.
For more information or ideas, please contact the office.
- https://www.fraserinstitute.org/commentary/canadian-families-must-work-nearly-half-year-pay-taxes
THE SEASON OF GIVING
Ways to Live a Longer Life — The Importance of Connection
In the longest-running study on happiness, the Harvard Study of Adult Development found that social connections are the strongest predictor of happiness and health, which in turn may contribute to greater longevity.1
Retirement planning is more than a “number.” Of course, our role is to support your wealth management so you have the means to live the life you envision in retirement and beyond. Yet often overlooked is how we’ll maintain life satisfaction as we age.
We live in an era of unprecedented global wealth, yet levels of unhappiness are at record highs. Social disconnection has become such a recognized issue that the UK and Japan have appointed government “Ministers of Loneliness,” and in 2023, the U.S. surgeon general declared loneliness an “epidemic.”2 A recent media headline even suggested that Gen Z may avoid the proverbial ‘midlife crisis’ not because they are happier, but because unhappiness has become so common much earlier in life.3 In the past, happiness tended to follow a “U-shaped” curve across the lifespan. Today, this may have shifted to an upward-sloping line, with young adults now the least happy and older adults reporting the greatest happiness.
Why this change is happening may be linked to various factors—the effects of job and housing prospects, the lasting impact of the pandemic, growing wealth inequality and, of course, the rise in social media and smartphones that have created a broader connectivity ecosystem inundating us with negative news and comparative envy.
This kind of connectivity, however, does not sustain us. A thriving human experience is fuelled by face-to-face interactions, which foster self-expression, creativity, optimism—and ultimately happiness.4 In fact, these interactions can help rewire our brains and change how we perceive the world in a more positive way. Neuroscience shows that in-person interactions engage the brain in beneficial ways that text messages or video calls cannot replicate.5
Is there any evidence to support this connectivity as a predictor of longevity? One study following nearly 1,500 older adults over a decade found that those with large networks of friends outlived those with fewer friends by more than 20 percent.2 Conversely, social disconnection is linked to higher risks of cardiovascular disease, stroke, depression, dementia and premature death. One study showed that loneliness increased the risk of early mortality by 26 percent and social isolation by 29 percent.6
The Longevity Benefits of Giving to Others
Importantly, connectivity is not only about how many physical friends we have, but also about how we engage with others. Those who participate in “prosocial” behaviours—acts intended to help or benefit others—tend to enjoy better health themselves. This can include volunteering or even making a charitable donation. For instance, seniors who spent about 15 hours per week tutoring and mentoring young children experienced measurable improvements in both cognitive and physical health. Volunteering has been linked to longer lifespans.7 Acts of giving can lower blood pressure, reduce stress and even decrease cortisol levels (the stress hormone), while boosting feel-good brain chemicals like dopamine and serotonin.8
This may be worth reflection as we enter the season of giving: In supporting causes that matter to us, we not only make an impact on others, but may also enrich our own health and happiness. Most importantly, staying connected helps us lead fuller, more satisfying lives as we plan for retirement and beyond.
- https://www.adultdevelopmentstudy.org/
- https://hsph.harvard.edu/news/the-importance-of-connections-ways-to-live-a-longer-healthier-life/
- https://www.newsweek.com/gen-z-midlife-crises-happiness-mental-health-2120019
- https://www.washingtonpost.com/wellness/2024/05/28/in-person-friendships-health-benefits/
- https://www.sciencedirect.com/science/article/pii/S1053811922007984; https://www.nature.com/articles/s41598-024-52587-2
- https://pubmed.ncbi.nlm.nih.gov/25910392/
- https://journals.sagepub.com/doi/10.1177/1359105305057310
- https://pubmed.ncbi.nlm.nih.gov/16905215/; https://longevity.stanford.edu/lifestyle/2025/01/24/why-giving-is-good-for-your-health/
Charitable Giving Opportunities
There are many ways to support charitable causes; some may even offer tax benefits. Here are several options to consider:
Cash Donations — Donating cash to a registered Canadian charity entitles you to a donation tax credit. The credit can be claimed by a spouse. Donations can be carried forward for up to five years, allowing you to maximize tax efficiency.
Donating Appreciated Securities — Gifting publicly-traded securities with accrued capital gains to a registered charity not only entitles you to a tax receipt for the fair market value, but also eliminates the associated capital gains tax.
Donor-Advised Funds (DAF) — A DAF allows you to make a contribution today, tax-deductible in the year it is made, while recommending how and when funds are granted in the future.
Life Insurance — Insurance can be used in various tax-efficient ways to support a charity. You can name a charity as the beneficiary of a policy, so they receive the death benefit tax free. In some cases, a charity can purchase a policy on your life, with you making annual cash donations to cover premiums. You receive a tax credit for the annual donation, while the charity receives future policy proceeds. The policy can also be funded with donated appreciated shares, providing additional tax benefits.
Charitable Foundations or Other Major Gifts — Where major gifts are concerned, we have access to resources and experts who can assist, so please don’t hesitate to reach out.