The Shifting (Global) Order
We are living through a period of shifting order. Global alliances are outwardly frayed, old rules have been bent, and new ones are being formed. As Prime Minister Carney reminded the world in January: “The old order is not coming back. We shouldn’t mourn it. Nostalgia is not a strategy.”1
Indeed, the shifts appear to be more rapid, with a near-constant stream of geopolitical surprises that have become almost routine. Amid shifting U.S. trade and tariff measures, evolving foreign policy and even war, uncertainty has grown and global conflict has widened. Even before recent events, there was a notable flight to safety in precious metals while the U.S. dollar declined. These defensive trades prompted some to ask once again: Is gold becoming the global reserve currency?
For now, they reflect a world placing greater focus on sovereign resource security and geopolitical insulation. Of course, geopolitics and economics remain intrinsically intertwined: while geopolitics explains how global leaders interact with their counterparts, economics can influence, and more importantly, constrain, their ambitions.
As events continue to reshape the global order, oil prices have spiked, renewing inflation worries. Over recent months, there have been broader shifts in markets. Technology stocks, long the market’s darlings, have faced pressure despite many posting solid earnings. Elevated capital spending has continued to draw scrutiny, even though returns on such investments can take years to materialize. Concerns about artificial intelligence’s potential to disrupt have also extended across sectors.
There has also been a rotation toward more undervalued market sectors. The Dow, considered by some young investors as “about as relevant as paper stock certificates or ticker tape,” outperformed the S&P 500 and NASDAQ to start the year, prompting headlines like “Boring is Back.”
Meanwhile, amid all of these shifts, some order emerged: the U.S. Supreme Court ruled that invoking tariffs under the Emergency Economic Powers Act was not legal. Although not expected to change the current administration’s approach, its clear legal boundaries augur well for the future. Nevertheless, uncertainty remains as renegotiations for the U.S.-Mexico-Canada Agreement (USMCA) draw near.
While the skies may appear cloudier for Canada’s economic prospects as a middle power, our position shouldn’t be underestimated: an energy superpower with vast natural resources, abundant fresh water, three coastlines, the world’s most-educated population and political stability. We have undoubtedly been dependent on the U.S., given our close proximity. Even so, an Oxford Economics analysis suggests that a full USMCA collapse would reduce Canada’s GDP by about 1.8 percent below baseline and cut private investment by 6 to 7 percent.2 By comparison, the early 1980s recession, driven by high inflation and high interest rates, saw output fall by 5 percent and unemployment reach 12 percent, a reminder that Canada has endured far more severe shocks and recovered.
Against this shifting backdrop, the growing dispersion we see today rewards a thoughtful and selective investment management approach. At a time when uncertainty feels amplified and global policy-making remains volatile, discipline becomes increasingly important, particularly when the range of possible outcomes is wide. The constant shifts should also remind us that no cycle, policy regime or market trend is ever permanent, reinforcing the importance of maintaining a longer-term view.
As advisors, we are here to help you navigate this shifting order. We continue to monitor the evolving global situation. If you have questions or concerns, please don’t hesitate to reach out.
Wishing you warmer days ahead.
1. World Economic Forum, Davos, January 2026.
2. https://www.oxfordeconomics.com/resource/usmca-scenarios-north-american-trade-at-a-crossroads/
gold & silver’s run
The Debasement Trade Amid Geopolitical Tensions
Gold and silver opened the year with substantial momentum. By the end of January, silver had surged to around $120 per ounce (intraday), up 63 percent in the month alone and up more than 248 percent year over year. Gold futures posted their largest single-day dollar gain on record, rising about $231 per ounce, while spot prices reached $5,600 (intraday), up 92 percent from a year earlier. In early February, both metals corrected sharply, retracing part of January’s rapid advance.
What was driving demand? Some market observers point to the “debasement trade”: an effort to preserve purchasing power amid monetary expansion and fiscal strain. The investment thesis is simple: when governments expand the money supply aggressively, keep interest rates below inflation or run large fiscal deficits, the real value of cash and fixed-income assets erodes. For investors worried about weakening currencies, gold and silver act as tangible assets with no sovereign liability attached. Recent developments have reinforced these concerns. In Japan, long-term government bond yields surged to record levels after the government unveiled a plan to increase spending while cutting the consumption tax in January.
Geopolitical Tension & the Commodities Imperative
Monetary concerns are only part of the story. Geopolitical tensions are reshaping capital flows and reserve strategies. Trade wars, tariffs and sanctions risks have pushed some governments to prioritize resource security, including stockpiling critical commodities. At the same time, the broader shift from global interdependence toward national self-sufficiency is strengthening demand for real assets. Since 2022, central banks including Poland, Turkey, India, China and Kazakhstan have significantly increased gold reserves partly as protection against geopolitical pressure or financial sanctions. This has raised the question: Is a commodities supercycle underway?
U.S. Dollar & Treasuries: Under Pressure
Traditional safe-haven assets are also facing scrutiny. For decades, the U.S. dollar and Treasuries were regarded globally for their stability, but this view may be changing. The dollar fell to a four-year low in January, fuelling headlines such as “How Trump Is Debasing the Dollar and Eroding U.S. Economic Dominance.” With lower interest rates and pressure for further cuts, the relative appeal of Treasuries may be diminishing. Other safe-haven currencies are also under pressure. The Japanese yen has weakened amid inflation and fiscal stimulus, leaving the Swiss franc as one of the few currencies still widely viewed as reliable.
What comes next? Given the scale and speed of gains, it’s reasonable to ask whether certain defensive trades were overextended. By historical standards, gold and silver’s early-year surge was steep. Still, the underlying drivers persist, including monetary expansion and geopolitical fragmentation. In such an environment, diversified exposure to defensive sectors, including commodities, alternative assets and resilient segments of the equity market, can help mitigate risks tied to inflation, currency erosion and geopolitical shocks.
Surging Prices: Silver & Gold, Jan. 29, 2026
|
|
Price1 |
January Gain |
Gain Over 20252 |
Year-Over-Year3 |
|
Silver |
$115.79 |
+63% |
+141% |
+248% |
|
Gold |
$5,377 |
+25% |
+64% |
+92% |
1. At close; 2. 12/30/24 to 12/31/25; 3. 1/27/25 to 1/27/26.
A brief look across four decades
Global Equity Market Perspectives: Nothing Is Permanent
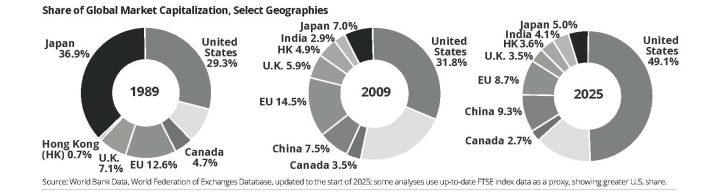
The share of global GDP among the world’s largest economies continues to shift, shaped by economic policy, technology and demographics. Equity market share has also shifted over decades.
How have things changed? Seasoned investors may recall a time when the prevailing view was that Japan would surpass the U.S. as the world’s largest economy. During the late 1980s Japanese asset price boom, the Nikkei 225 rose from about 12,000 in 1985 to 38,915 in 1989: a 225 percent gain in four years. At that time, land under Tokyo’s Imperial Palace was said to be worth more than the entire state of California. In 1989, Japan held nearly 40 percent of global market capitalization. Two decades later, its share had fallen to just 7 percent. Meanwhile, the developing economies of China and India, largely absent from charts in 1989, were rapidly expanding. Today, they together account for over 13 percent of global market value.
Where will we be in the next 20 years? Japan’s experience reminds us that economic leadership is never fixed, and today’s assumptions about global dominance may look very different in the future.
Share of Global GDP (%) of Select Countries/Regions
|
|
USA |
EU |
Japan |
China |
India |
Canada |
|
1989 |
27.9% |
24.9% |
15.4% |
2.3% |
1.5% |
2.8% |
|
2009 |
23.6% |
24.2% |
8.6% |
8.5% |
2.2% |
2.3% |
|
2025 |
26.1% |
18.0% |
3.7% |
16.6% |
3.5% |
1.9% |
Source: IMF World Economic Outlook (October 2025 Dataset).
tax season is here again
When It May Pay to Defer Deductions
Tax season is here again. Most taxpayers are eager to maximize deductions to minimize the taxes they pay. However, careful attention to tax planning may mean doing the opposite. In some situations, it may be beneficial to defer making deductions to achieve a greater future tax benefit. Here are some perspectives:
Registered Retirement Savings Plan (RRSP) — There may be situations in which delaying your RRSP deduction makes sense. If you expect that you will be in a higher tax bracket in future years, you can make a contribution up to your limit but not take the RRSP deduction in the year of contribution and, instead, carry that amount (or a portion of it) forward. Or, you can defer contributing until the year when you anticipate being in the higher tax bracket to maximize the taxes saved. Unused RRSP tax deductions can be carried forward indefinitely.
First Home Savings Account (FHSA) — Similar to the RRSP, if you have opened and contributed to a FHSA, you can carry forward undeducted contributions to a later year — and, generally, even beyond the FHSA’s closure. This may be beneficial for younger folks who might expect to be in a higher tax bracket in future years.
Charitable Donations — Eligible donations don’t have to be claimed in the year made and can be carried forward and claimed within the next five years. The federal tax credit has two tiers: 14.5 percent (for 2025, or 14 percent for 2026) on the first $200; 29 percent on amounts above $200 (33 percent if taxable income is in the highest tax bracket), with additional provincial credits. If you make smaller donations over different years, it may be beneficial to delay a claim and combine donations together to maximize the amount that generates the higher tax credit. As well, spouses may be able to claim each other’s unused charitable donations (including carried-forward amounts) from previous years to optimize the tax credit.
Capital Losses — If an investment is sold for less than its adjusted cost base in a non-registered account, the loss may be recorded as a capital loss. Net capital losses can be carried back three years or forward indefinitely to offset taxable capital gains. You can choose to apply them in a year when you have larger gains or a higher income to maximize the tax benefit.
Medical Expenses — Eligible medical expenses may be claimed as a federal non-refundable tax credit once they exceed a threshold. The claimable amount is the portion of expenses above the lesser of 3 percent of net income or $2,834 (for the 2025 tax year). Provincial or territorial medical expense tax credits also apply. Medical expenses do not need to be based on the calendar year and may be claimed for any 12-month period ending in the tax year (provided they were not claimed previously). Therefore, it may be beneficial to delay claiming expenses if doing so allows you to include them in a 12-month period that produces a larger claim.
Tuition Tax Credit — Many students don’t use their tuition tax credit to reduce taxes because they have limited income at school. Up to $5,000 of unused tuition amounts can be transferred to a spouse, common-law partner, parent or grandparent. Any remaining amount can be carried forward indefinitely to future years. However, once a student has federal tax payable, they must generally use available carried-forward tuition amounts to reduce that tax before claiming certain other non-refundable credits.
inflation & affordability challenges
Canada: “Food Inflation Capital” of the G7
It may be difficult to recall a time when a litre of gas was 52 cents and a carton of eggs was just $1.64. That was 30 years ago. Fast forward to today, and Canada has now earned the title of “food inflation capital” of the G7 (Group of Seven advanced economies), with food prices rising by 6.2 percent in 2025 alone.1 In response, Prime Minister Carney recently introduced the Canada Groceries and Essentials Benefit (CGEB) rebate (an expansion of the existing GST/HST rebate) targeted at low-income earners.
While the Consumer Price Index (CPI), the federal government’s official measure of inflation, suggests average prices have risen roughly 88 percent over three decades, your grocery bills likely tell a very different story (chart). Inflation becomes especially troubling when incomes fail to keep up. For a growing portion of the population, this is a reality. When expenses, especially those like education and housing, become harder to afford, the impact is not just financial; it can influence confidence in economic opportunity and heighten social divides.
While affordability has come under increasing pressure, long-term investment performance paints a more encouraging picture. Throughout the same period, investors have seen the S&P/TSX Composite Index rise more than 573 percent, even before accounting for reinvested dividends. That growth has outpaced the price increases across every category on the chart, including average home prices during a prolonged housing boom.
Of course, those gains did not come without volatility, including four bear markets spanning a combined 40 months, two of which saw declines of more than 45 percent. Still, for those who stayed the course, equities have proven to be one of the most effective tools for building wealth and offsetting inflation over the long run. If history is any guide, that’s encouraging news for long-term investors looking ahead to the next 30 years.
1. www.theglobeandmail.com/business/article-food-inflation-retail-decoder/
Changes in (Nominal) Prices of Select Items: 1995 & 2025
|
|
1995 |
2025 |
Change |
|
Ground Beef (1 kg)1 |
$3.80 |
$15.54 |
+309% |
|
Chicken (1 kg, breast)1 |
$3.75 |
$15.19 |
+305% |
|
Eggs (1 dozen)1 |
$1.64 |
$4.74 |
+189% |
|
Coffee, Roasted (300g)1 |
$3.86 |
$8.25 |
+114% |
|
Oranges (1 kg)1 |
$2.30 |
$4.46 |
+94% |
|
Unleaded Gas (Reg, c/L)2 |
50.2 |
137.0 |
+173% |
|
Consumer Price Index3 |
88.01 |
165.4 |
+88% |
|
University Tuition4 |
$2,384 |
$7,734 |
+224% |
|
Cdn. Family Income (Median)5 |
$41,343 |
$130,120 |
+215% |
|
CMHC Median Home Price6 |
$170,000 |
$740,000 |
+335% |
|
S&P/TSX Composite Index7 |
4,661.18 |
31,382.80 |
+573% |
1. Statistics Canada (StatCan) T-18-10-0002-01 (November 1995 data); Table: 18-10-0245-02 (November 2025 data); 2. StatCan T-18-10-0001-01 (November 1995 & 2025 data, Toronto); 3. https://www.bankofcanada.ca/rates/price-indexes/cpi/; 4. https://www150.statcan.gc.ca/t1/tbl1/en/tv.action?pid=3710004501; 5. https://open.canada.ca/data/en/dataset/cf5a0c30-8893-11e0-b0f5-6cf049291510; StatCan T-1110019101; for 2025 data, $121,000 (2023), with 3.6% (2024) & 3.8% (2025) wage growth assumptions; 6. CMHC New Build Median Price; https://www.cmhc-schl.gc.ca/professionals/housing-markets-data-and-research; 7. At close 11/30/95 and 11/28/25.
insurance strategies for high-net-worth investors
The RRSP/RRIF Exit Strategy: Joint Last-to-Die Insurance
Many of us spend years contributing to our Registered Retirement Savings Plan (RRSP) to take advantage of the tax-deferred growth opportunity. Yet we may forget to plan our exit strategy: how and when that money will be withdrawn in the future.
The issue? Every dollar withdrawn from the RRSP is subject to tax as regular income. While postponing withdrawals until retirement is often beneficial, because in many cases the individual will be in a lower marginal tax bracket, waiting too long can create other issues. By age 71, the RRSP would likely be converted to a Registered Retirement Income Fund (RRIF), forcing the planholder to withdraw specified percentages of the RRIF, whether funds are needed or not. In addition, leaving significant RRSP/RRIF funds to beneficiaries at death can result in a substantial tax liability. If there is no qualified rollover beneficiary, the full value is included in the deceased’s final tax return, which, for many high-net-worth (HNW) investors, can be taxed at the highest marginal rate.
Couples: Joint Last-to-Die Insurance as a Solution
If RRSP/RRIF funds aren’t needed as income in retirement, using joint last-to-die insurance may be a solution. It allows you to reposition assets during your lifetime, while preserving estate value through tax-free insurance proceeds. Withdrawals from a RRSP/RRIF are taken over time to fund the insurance policy, which may be subject to relatively lower marginal tax rates compared to taxes at death. The life insurance policy helps preserve the after-tax estate value for beneficiaries by replacing assets withdrawn and taxed during retirement.
How Does It Work?
Consider the situation in which a couple is planning to leave their estate to their children. Each spouse can designate the other as the beneficiary of their own RRSPs and purchase joint last-to-die life insurance with the children as beneficiaries of the insurance policy.
At retirement, withdrawals from the RRSP or, later, the minimum RRIF withdrawals, can be used to pay the insurance premiums. By making use of the spousal rollover provision available, there will generally be no RRSP/RRIF-related taxes due on the death of the first spouse, as the RRSP/RRIF will transfer to the other spouse without tax implications. Upon the death of the surviving spouse, insurance proceeds will be generally paid out tax-free to the beneficiary(ies).
This strategy may help manage or reduce overall lifetime and estate tax exposure in certain situations. In many cases, joint last-to-die life insurance can help preserve or enhance the value of an estate. In provinces where estate administration tax (or probate) is assessed, there may be additional savings as life insurance proceeds bypass the estate.
The proceeds paid out from the joint last-to-die life insurance policy can be designated to offset future tax liabilities. For example, the insurance policy proceeds can cover taxes arising from the deemed disposition of capital assets, without requiring the liquidation of the estate assets to fund the tax liability. Alternatively, proceeds can be used to create a legacy by naming a charity as the designated beneficiary.
The joint last-to-die policy is often more cost-effective than the purchase of two individual single life policies since the insurance company does not plan to pay out the proceeds until further into the future, and it will only need to pay this out on one policy rather than two.
Determining if life insurance can play a role in your estate plan will depend on your circumstances and your future goals. Given our familiarity with your investments, we would be pleased to provide perspectives on this, or other insurance-related matters.
Insurance: Strategic Estate Planning for HNW Families
Here are just a handful of ways insurance can help to support estate planning for high-net-worth estates:
tax season PERSPECTIVES
Planning Ahead: Six Ways to Minimize Taxes on Your Estate
It is tax season once again. While many of us focus on reducing this year’s tax bill, it’s also a good time to consider how to manage future tax obligations. After all, as the old saying goes, “nothing is certain but death and taxes.” Planning ahead can help preserve more of your hard-earned wealth for your heirs, rather than the tax authorities.
In Canada, unlike the U.S., there is no estate tax in the traditional sense. Instead, you are deemed to have disposed of your assets at fair market value at death, and your estate is subject to tax on any accrued gains. For many estates, the greatest tax exposure comes from registered accounts such as Registered Retirement Savings Plans (RRSPs) or Registered Retirement Income Funds (RRIFs), capital gains in non-registered accounts and appreciated assets like vacation properties or other real estate.
Here are six ways to help minimize taxes on your estate:
1. Defer Taxes — In some cases, the tax liability on appreciated assets can be so significant that estates are forced to liquidate assets, such as a business or family cottage. Deferring taxes can help avoid this. A spousal rollover allows assets to transfer to a surviving spouse, spousal trust or certain eligible beneficiaries (i.e., disabled child, financially dependent child) on a tax-deferred basis, with the associated tax liabilities being deferred until your spouse dies or assets are sold.
2. Use Exemptions — Tax exemptions can provide meaningful savings. For example:
3. Don’t Overlook Foreign Estate Taxes — If you own assets outside Canada, or if your beneficiaries live in a country with an estate tax, planning is important. Many Canadians own U.S. assets. U.S. “situs” property, which includes U.S. real estate and shares in U.S. corporations, may be subject to the U.S. estate tax. (For dual citizens, U.S. citizens residing in Canada or Canadian citizens considered residents of the U.S., U.S. estate tax may apply to worldwide assets.)
There may be strategies to minimize potential U.S. estate tax, including disposing of U.S. situs assets before death, using joint ownership for U.S. property (which may help defer or reduce exposure, depending on ownership structure) or using a Canadian holding company, trust or partnership to own the U.S. situs assets. It’s also important to note that tax law can change (see inset for recent changes to the U.S. estate tax law).
4. Freeze Taxes — Business owners may choose to freeze the value of their business for tax purposes today, while transferring future growth to the next generation. By using an estate freeze, you can continue to control the business and lock in your future tax obligations, while the other party benefits from any increases in the value of the business (but is also liable for the future taxes on the growth).
5. Plan on Giving — Leaving a legacy through charitable donations can create a lasting impact while reducing taxes. Properly structured gifts may significantly reduce tax in the year of death and the preceding year. In the year of death, the maximum donation amount increases to 100 percent of net income (up from the 75 percent limit in a normal year).
Gifts made during your lifetime, such as contributions to family members or charitable causes, can also reduce the size of your taxable estate while providing immediate benefits.
6. Use an RRSP/RRIF Drawdown Strategy — Registered retirement accounts often represent one of the largest tax liabilities at death. A proactive drawdown strategy may help reduce this exposure. Instead of withdrawing only the required minimum amounts, some retirees choose to gradually withdraw additional funds during lower-income years, smoothing income over time and potentially paying tax at lower marginal rates. This approach can also allow assets to be reinvested in more tax-efficient vehicles, such as a Tax-Free Savings Account (TFSA), or support gifting strategies. However, be aware that higher withdrawal amounts may have other consequences, such as potentially triggering the OAS clawback.
Plan Ahead
Estate tax planning can significantly affect what you leave behind. Professional advice can help ensure your strategy is structured properly, allowing you to preserve more of your estate for the people and the causes you care about.
Note: Tax minimization is only part of the planning equation. There may be planning techniques, including the use of insurance, to help fund estate taxes and avoid the forced sale of assets. For a deeper discussion, please call.
Recent Changes to the U.S. Estate Tax
For those Canadians holding significant U.S. situs assets, the U.S. estate tax was scheduled to “sunset” as of January 1, 2026, reverting to between US$5 million and US$6 million per person, indexed for inflation. However, under the One Big Beautiful Bill Act, the U.S. estate tax exemption was “permanently” increased to US$15 million per person (US$30 million for married couples) as of January 1, 2026, with future indexing for inflation. Of course, no tax-related legislation can truly be considered permanent, but the increased exemption provides near-term planning certainty for high-net-worth Canadians with significant U.S. situs assets.
Are you making the most of tax-advantaged tools?
The FHSA: Six Savvy Tips for Investors
Spring’s arrival brings home-buying season, making it an opportune time to revisit a valuable tool that supports the purchase of a first home: the First Home Savings Account (FHSA). The account offers tax-deductible contributions, tax-free growth and tax-free withdrawals for qualifying home purchases. Generally, you must be a “first-time homebuyer” who is a Canadian resident over the age of majority, but not older than 71 on December 31 of the year in which the account is opened.
Here are six tips to make the most of the FHSA:
1. Even if you’ve owned a home before, you may still qualify. If you or your spouse/partner has owned a house in the past, you may still qualify if you haven’t owned a home in the current year and in the preceding four calendar years. People also often assume that FHSAs are just for young buyers. However, “seasoned” investors who haven’t owned a home in recent years might consider opening one, even if it isn’t used for a home purchase, as it may act as a retirement savings boost (see point #6, below).
2. Maximize contributions early for compounded growth. The FHSA allows annual contributions of up to $8,000, with a lifetime limit of $40,000. However, the FHSA must be closed by December 31 of the earliest of: the 15th anniversary of opening, the year following the first qualifying withdrawal, or the year the account holder turns 71. As such, not contributing the full $8,000 each year risks missing out on the lifetime limit, its tax-deductible benefits and the potential for tax-free growth over time.
Consider the scenario in which an investor contributes the maximum each year from the outset. At a 5.5 percent annual return, by year 5, the $40,000 contribution would grow to $47,104. But by year 15, it could grow to over $80,000; all tax-free upon withdrawal for the purchase of a first home.
3. Carry forward contributions for future tax savings. Like a Registered Retirement Savings Plan (RRSP), FHSA contributions are tax-deductible, and any unused deductions can be carried forward to a future year, even beyond the closure of your FHSA.1 If you expect to be in a higher tax bracket in a future year, claiming the deduction later may help maximize your tax savings.
4. Be aware that the “carry-forward” rules differ from other registered plans. This has been a source of some confusion. For the FHSA, an account holder can contribute $8,000 in annual participation room. Unused amounts can be carried forward to the following year, but only to a maximum of $8,000 and subject to the lifetime limit of $40,000. This differs from the Tax-Free Savings Account (TFSA) and RRSP, where unused contribution room is carried forward indefinitely (to age 71 for the RRSP); there is no limit. Take, for example, an individual who opened the FHSA in 2024 and contributed $4,000. In 2025, the FHSA would have $12,000 in participation room: $8,000 of new room for 2025 and $4,000 carried forward from 2024. If they do not contribute in 2025, they would have $16,000 of participation room in 2026, not $20,000, as only $8,000 carries forward from 2025. Excess contributions are subject to a penalty of one percent per month.
5. Combine the FHSA with the RRSP Home Buyers’ Plan (HBP). You can use the FHSA alongside the RRSP’s HBP. As of 2026, the HBP now allows you to withdraw up to $60,000 from your RRSP for a first-home purchase without tax consequences, subject to HBP repayment rules. Using the scenario above, if the FHSA grows to $80,000 and you use the full RRSP HBP, you could have $140,000 toward your first home.
6. Transfer unused FHSA funds to an RRSP or RRIF. If you do not use the FHSA to purchase a first home, assets can be transferred tax-free to an RRSP or Registered Retirement Income Fund (RRIF), essentially giving you additional contribution room for retirement savings.
A Reminder: FHSA Potential Growth at 5.5% Annual Return
|
Year |
Contribution |
End of Year |
|
1 |
$8,000 |
$8,440 |
|
2 |
$8,000 |
$17,344 |
|
3 |
$8,000 |
$26,738 |
|
4 |
$8,000 |
$36,649 |
|
5 |
$8,000 |
$47,104 |
|
6 |
— |
$49,695 |
|
…10 |
— |
$61,564 |
|
…15 |
— |
$80,461 |
Be Aware: FHSA Contribution Room May Be Incorrect
If you’ve helped a younger family member open an FHSA in recent years, be aware that the Canada Revenue Agency (CRA) may have inaccurate contribution data. The consequence, of course, is the one percent per month penalty on excess contributions, which can quickly add up. Reports indicate that various FHSA holders have already been assessed these penalties.
A recent Globe & Mail article highlighted the source of the problem: “Schedule 15—FHSA Contributions, Transfers and Activities” must be attached to a tax return whenever a contribution or withdrawal is made.1 Since the form was introduced in 2023, some tax software did not automatically include it, leading to certain 2023 contributions being misclassified as 2024 overcontributions. To fix this, it is advised to contact the CRA and amend the 2023 return using Schedule 15.
1. “How we fixed a $1,000 FHSA tax penalty,” B. Leung, Globe & Mail, January 30, 2026, B11.
a notable rotation
Is the Small-Cap Surge Here to Stay?
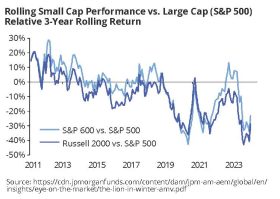
Since October 2025, U.S. small-cap stocks have staged a notable comeback, outperforming large-cap growth stocks as investors look beyond years of dominance by tech mega-caps. This has prompted the question: Is this a temporary bounce, or the start of a more meaningful trend?
Small Caps vs. Large Caps
In the U.S., small-cap stocks are generally defined as companies with a market capitalization (share price multiplied by shares outstanding) between $250 million and $2 billion. The Russell 2000 and S&P 600 are the most commonly used U.S. small-cap benchmarks. In Canada, where markets are smaller, small caps are generally considered to have a market capitalization of $1.5 billion or less. In contrast, a large-cap stock generally refers to a company with a market capitalization exceeding $10 billion.
In the past, small caps were seen as attractive opportunities for those investors willing to take on more risk in exchange for potentially higher returns. These firms were perceived to have higher growth potential, as well as strong merger and acquisition prospects.
Yet, since 2010, small caps have largely underperformed large-cap stocks (see graph for relative performance) and have traded at some of their lowest levels in decades. The current cycle happened for a reason. Large caps have had stronger earnings and better free cash flow margins, while small caps exhibit much lower profitability. Small caps often carry higher debt positions (relative to earnings) and are more exposed to interest rate changes due to floating rate debt and shorter average maturities. Rising interest rates between 2022 and 2024 placed significant pressure on many small caps with rate-sensitive debt. In addition, small caps tend to be more sensitive to economic cycles than their large-cap counterparts.
At the same time, many higher-quality small-cap companies are not listing publicly, instead being taken private by private equity firms before reaching scale. Private markets have grown dramatically: In 2000, private equity and venture capital firms managed around $600 billion in assets; today, assets under management exceed $10 trillion. This shift has resulted in a greater proportion of lower-quality companies entering small-cap indices, which has challenged overall returns.
Why the Rotation Into Small Caps Over Recent Months?
As valuations for tech mega-cap growth stocks remained well above historical averages, investors turned to more undervalued sectors. Recent easing of cyclical headwinds, particularly higher interest rates that previously pressured small-cap valuations, has created a more favourable environment for these companies. A weaker U.S. dollar has further benefited small-cap firms with foreign revenue exposure, while improvements in the U.S. regional banking sector have helped support broader small-cap business activity. Ongoing fiscal stimulus measures provide an additional layer of support, enhancing the potential for selective opportunities within the sector.
A Selective Approach
The small-cap universe is highly diverse, with significant variation in company quality and performance. As with many aspects of successful investing, a selective approach can help investors manage structural risks while identifying businesses with stronger balance sheets, earnings resilience and longer-term potential. Even with a more favourable environment emerging for the sector, ongoing economic uncertainty makes disciplined, quality-focused stock selection increasingly important.
a Brief Look at the space sector
Expanding the Final Frontier: Growth of the New Space Economy
The commercial space sector is undergoing rapid transformation. At a time when initial public offerings (IPOs) have been sparse, the industry has captured attention. In February, SpaceX merged with xAI in a deal valuing the combined enterprise at roughly $1.25 trillion, confirming its intent for a public listing this year.
Momentum across the industry is accelerating, and launch cadence highlights this growth. In the first half of 2025, a global launch occurred roughly every 28 hours, compared to about one every 36 days in the 1950s.1 Orbital infrastructure has also expanded rapidly. In 2000, roughly 1,000 satellites were active; today, about 11,700 are active, with nearly 15,000 total.2 These systems underpin services essential to modern life, from broadband connectivity and navigation to weather forecasting and environmental monitoring.
Market Size and Growth Outlook
The global space economy is now valued at more than $700 billion and growing at about 8 percent annually. Projections suggest it could exceed $1.8 trillion by 2035.3 The satellite manufacturing and deployment segment remains a central growth engine, worth about $15 billion today and projected to reach $108 billion by 2035, driven by plans to deploy roughly 70,000 new low-Earth-orbit satellites.4
Four Forces Reshaping the Industry
Several structural shifts are driving momentum in the sector:
1. Growth of private capital and commercial leadership. Space activity was once dominated by government agencies such as NASA. Today, private companies are leading innovation and deployment. Firms like SpaceX, Blue Origin and Rocket Lab are driving innovation, supported by venture capital, private equity and alternative financing structures.
2. Falling launch and hardware costs. Access to space is becoming more affordable. Launch costs have declined sharply. A comparison of NASA’s Space Shuttle and SpaceX’s Falcon 9 indicates launch costs per kilogram to low‑Earth orbit have dropped by roughly 95 percent.5 Reusable launch systems and higher launch frequency, pioneered by SpaceX, have dramatically reduced costs, by some estimates roughly tenfold over the past two decades.
3. Rapid infrastructure scaling. Satellite deployment is expanding at an unprecedented speed. SpaceX’s Starlink operates more than 10,000 satellites that serve over 8 million customers.
4. Technological advancement. Emerging capabilities such as asteroid resource extraction and space mining may fundamentally change mission economics by sourcing fuel, water and raw materials in space, reducing dependence on Earth-based supply chains.
Core Segments of the Space Economy
The industry is often viewed across the value chain:
Investing in Space
With growing excitement around the sector, some investors have asked how to participate. Various options exist, each with distinct risks, including:
The Bottom Line
The space economy is expanding across multiple dimensions, fuelled by lower costs, increased capital and technological progress. Opportunities exist across a range of investment approaches, but careful risk evaluation is essential. For investors prepared to navigate these risks, space represents a new frontier, poised to drive a wave of technological innovation.
1. https://spacestatsonline.com/launches/
2. https://www.livescience.com/how-many-satellites-orbit-earth
3. https://www.weforum.org/press/2024/04/space-economy-set-to-triple-to-1-8-trillion-by-2035-new-research-reveals/
4. https://www.goldmansachs.com/insights/articles/the-global-satellite-market-is-forecast-to-become-seven-times-bigger
5. https://www.sec.gov/Archives/edgar/data/1841998/000118518523001114/abovespace_formc.pdf
IN BRIEF, macroeconomic perspectives
Trade and Tariffs: Perspectives on Where We Stand Today
As renegotiations over the U.S.-Mexico-Canada Agreement (USMCA) approach, it’s worth taking a brief look at trade to share perspectives on the framework that has governed North American trade since July 2020. The USMCA replaced the North American Free Trade Agreement (NAFTA), which was designed to support an integrated market based on free trade. It provides reciprocal tariff-free access among members, provided certain rules are met. Together, these agreements have shaped supply chains, supported investment and increased trade flows across North America for decades.
One of the greatest beneficiaries of the agreement has been the automotive sector, due to the scale, complexity and integration of supply chains across the continent. To qualify for zero tariffs, automobiles must meet strict regional value content thresholds, generally requiring that at least 75 percent of components be produced in North America, along with wage-related labour requirements. Production is now deeply integrated, with components often crossing borders multiple times during assembly.
In Brief: Where We Stand Today
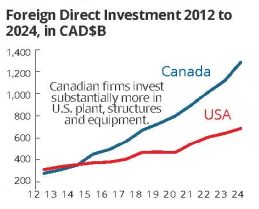
Given geographic proximity, Canada and the U.S. have long had extensive trade relations. Without a doubt, Canada’s dependence on the U.S. is substantial: roughly two-thirds of total exports go to the U.S., representing around 24 percent of Canada’s GDP.1
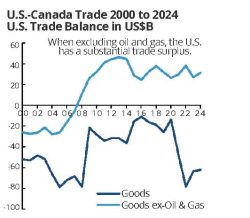
However, it’s not all one-sided. Claims that Canada is being “subsidized” overlook substantial reverse flows. Canadian firms invest more in U.S. plant, structures and equipment than U.S. firms invest in Canada. About 59 percent of Canadian imports come from the U.S., representing roughly one-quarter of Canada’s GDP, while the U.S. has a non-energy trade surplus with Canada (see charts).1
The Path Forward
Many economists expect the USMCA to survive in some form, likely on terms favourable to the U.S. A full dismantling would risk inflation, job losses and supply-chain disruption, particularly during a U.S. midterm election cycle.
It’s also worth noting that existing U.S. tariffs have had adverse effects on Americans. According to a report by the Federal Reserve Bank of New York, roughly 90 percent of the economic burden of the tariffs was borne by U.S. firms and consumers through 2025. Until now, they haven’t triggered broad inflation, largely because many firms initially absorbed the cost through slimmer margins or cost-cutting measures. But that buffering has limits. Recent reports suggest companies under sustained cost pressure are increasingly raising, or planning to raise, prices.2 This comes at a time when many Americans are already struggling with affordability.
Other economic effects have been more visible:
U.S. manufacturing has weakened. The expected tariff-driven revival has not materialized. More than 200,000 manufacturing jobs have been lost since 2023, and the Institute for Supply Management index of factory activity declined for 26 consecutive months through December 2025. Since many manufacturers rely on imported inputs, tariffs often raise production costs more than they provide protection.
Retaliation has had tangible consequences. While China suspended many retaliatory tariffs in 2025, it left duties on soybeans for most of the year, cutting off what had historically been the largest U.S. export market, worth roughly US$12 billion annually. By October 2025, five consecutive months had passed without a single U.S. soybean export to China,3 an unprecedented stretch, prompting roughly $12 billion in U.S. farm support by December. Purchases resumed before the month’s end, following a meeting between Trump and Xi Jinping.
Closer to home, Canadian travel to the U.S. has dropped sharply over the past year, with an estimated US$4.5 billion in lost tourism revenue.4 Last year, it was reported that U.S. spirits exports to Canada, valued at about $250 million annually, were down by 85 percent.
Political pressure is rising. The economic effects of tariffs are translating into political action. In February, six Republican senators joined Democrats in supporting the repeal of tariffs on Canada, breaking with President Trump. While a full repeal remains unlikely, the vote signalled mounting concern about their economic impact.
1. https://www.scotiabank.com/ca/en/about/economics/economics-publications/post.other-publications.global-week-ahead.january-23–2026.html
2. https://www.wsj.com/business/price-increases-consumers-businesses-b70e4542
3. https://www.forbes.com/sites/kenroberts/2026/01/17/china-purchased-no-us-soybeans-an-unprecented-sixth-straight-month/