When the Facts Change…
If we were to ascribe an overriding theme to our last commentary piece we wrote in March, especially vis a vis our intentions towards the asset allocation and risk posture among our various models, it would have been one of having patience and maintaining defensive positioning. As justification, we cited some historical evidence that severe drawdowns in equity markets, especially when associated with an economic recession, had often involved retests of the lows or at least a bottoming process that was anything but “V” shaped. At the time, we shared the following chart that highlighted this historical pattern quite well.
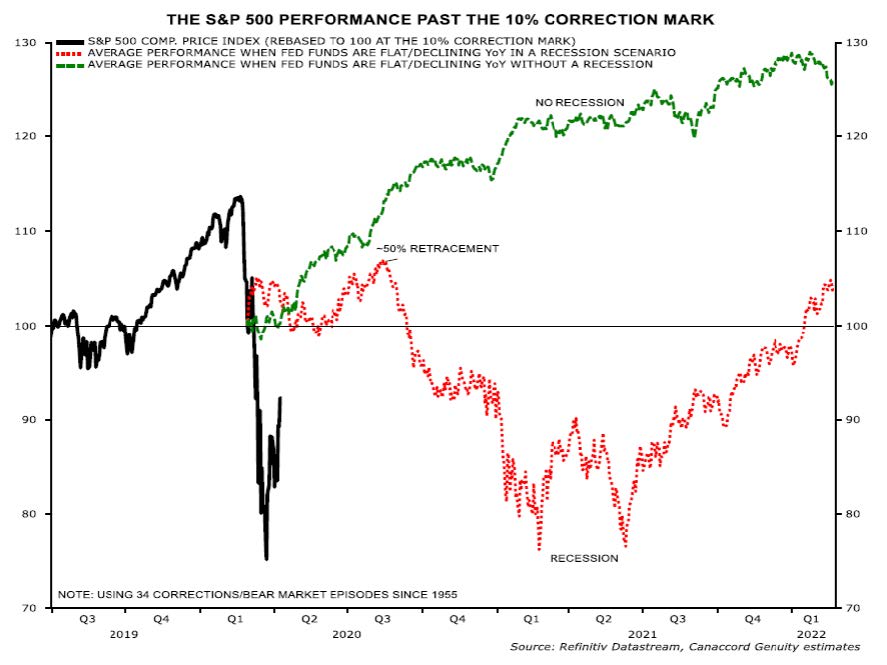
With these precedents in mind, it was our stated approach to maintain a low portfolio beta (a measure of systemic risk and exposure to volatility) to equity markets until which time that the panoply of asset markets’ behaviors, cross-asset relationships, and economic indicators we monitor would inform us otherwise. Late in May, much to our surprise, they in fact did.
Contrary to the rather grim headlines in the press, numerous data points we follow in markets indicated constructive signals and we, always wanting to be data-driven in our decision making, adjusted our asset allocations across all models to increase equity exposure and risk-on posture (we will send out a separate note detailing specific model changes in the coming weeks).
The Trend is Your Friend
One of the primary signals we were monitoring was the general trend of the overall market and in the case of the following example, the behavior of the S&P500. We will cite this and other U.S. indices, in addition to U.S. economic data points throughout this note, due to their being generally considered the most prominent markets in the world, often setting the tone for risk sentiment globally, not the mention being a prominent component of our geographic asset allocation.
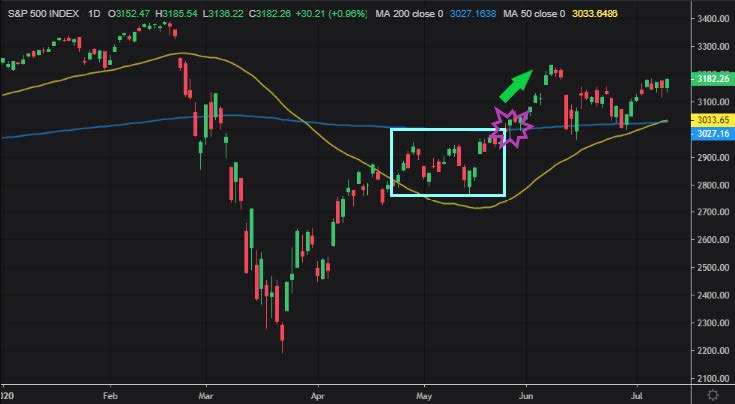
After the initial bounce of the S&P500 from the March lows, the index seemed to get stuck in a consolidation pattern from mid-April to mid-May (light blue rectangular area), with the 200-day moving average (blue line) seeming to serve as a technical ceiling against any further market advances. As the 200-day is generally considered a major long-term trend indicator, many investors consider an asset’s price trending either above the line as bullish or below the line as bearish. When an asset’s price crosses the line, it is often perceived as signaling a major transition in the asset’s trend character or the inability of that asset’s price to cross the line as a repudiation.
So with this in mind, as the S&P500 came up to this important threshold from below, its initial inability to penetrate through and above the 200-day moving average, only served to reinforce our base case that the bounce from its March low was only a reflexive counter-move within a broader bearish trend and that the S&P500, and most equity markets for that matter, were to resume their downtrend once more.
Then, in late May, the opposite happened. The S&P500 not only broke through and above the 200-day moving average, it did so in a forceful fashion. This move was, in our minds, the market crossing a proverbial Rubicon delineating a bear-market rally into new bull market that had in fact started back in March. In crossing this threshold, the market’s move compelled us to re-evaluate our asset allocation weightings and risk posture across all our models.
This was then followed by signals from a host of other assets and indicators providing confirmation in those same weeks (a small sample of which we will review through the course of this note), so we promptly decided to move towards a greater weighting in equities across all models. Simply put, we adjusted our positioning from a defensive posture to a cautiously bullish one.
Source: Refinitiv Workspace
In the months since, not only has the S&P500 now held above the 200-day moving average, treating what was once a ceiling as now a floor, but a confirmation signal in the 50-day moving average (yellow line) just crossing recently above the 200-day moving average, a pattern colloquially referred to as a “Golden Cross,” provide us further evidence of the validity of our assessment.
Growth vs. Value
One of other the reasons why we initially doubted the S&P500 rally from the March low, was because it looked as though the broader index was being dragged higher by outperformance of mega-cap technology and health names, as investors flocked to either “no-brainer” secular growth names that were the least affected economically or in the case of health care stocks, to those that would nominally benefit from the health situation surrounding the pandemic.
It was our fear that this investor crowding would lead to dangerous overconcentration in a few major stocks (especially FAAMG – Facebook, Apple, Amazon, Microsoft, Google/Alphabet), leaving the overall market with poor breadth and a shaky foundation to the rally. These Growth factor sectors were recovering back to their pre-Covid-19 prices leaving the Value factor sectors (what we would consider more cyclical and economically sensitive) languishing far behind. In fact, those Value sectors were even beginning to reverse into downtrends by April.
We saw this wide divergence forming as a significant problem in market internals that needed to resolve itself, with our base case expectation that Growth sectors would lose steam and catch down to the downtrodden reality that Value sectors were pricing in from the current economic situation. Then, in late May, Value sectors wound up reversing what was looking like an ominous downtrend and promptly broke out higher in a mad dash to catch up with their Growth brethren.
This giant rotation from Growth sectors into Value sectors, as seen in the chart below with Growth in blue and Value in yellow, was exactly the sort of back and fill that we felt the overall market would need see to justify and confirm the March rally. The burst higher in Value names has since lost some steam more recently as these sort of stocks seemed to have gotten ahead of themselves by mid-June and renewed COVID-19 concerns began to cloud their outlook once more, but we would not be surprised to see a pattern emerge of Growth sectors surging first, consolidating, and then Value names subsequently catching up.
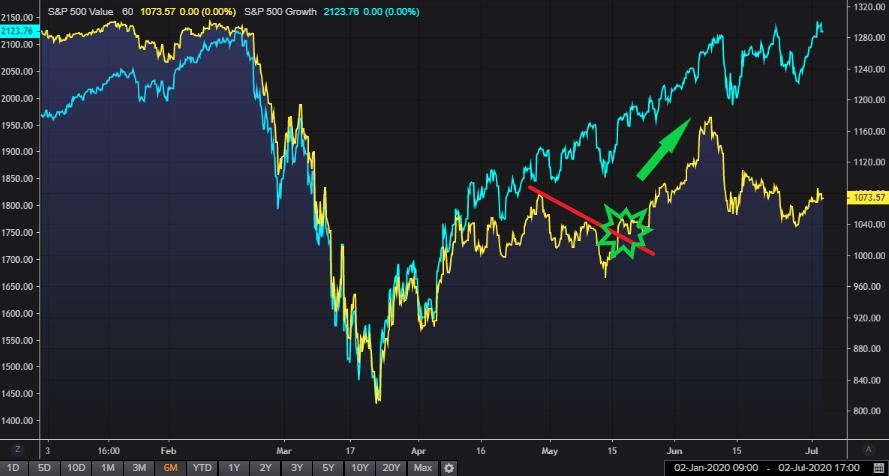
Source: Refinitiv Workspace
Confirmation, Confirmed
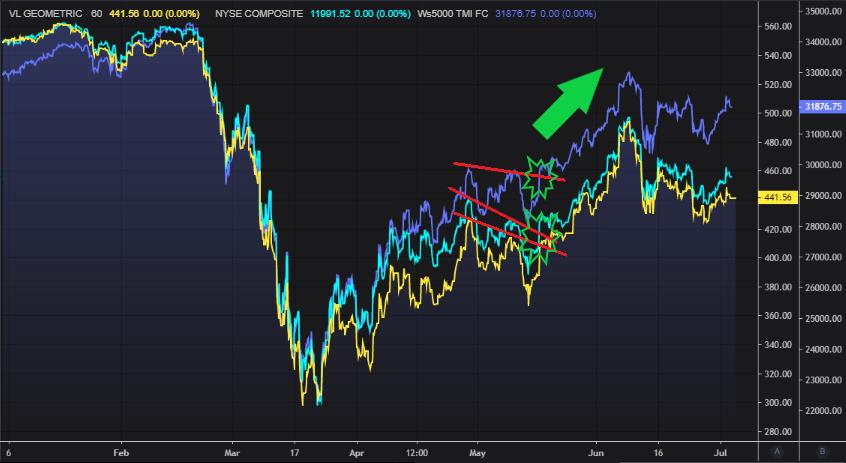
Along with the said rotation into Value sectors in late May, the improvement in overall market breadth that we were waiting to see before changing our stance manifested itself simultaneous in numerous other market indices composed of broader and more diffuse collections of stocks.
Given the S&P500 is heavily weighted to the largest companies, we wanted to see similar price action in other more differently composed indices to provide confirmation of constructive breadth for the advance. For instance, looking at indices such as the Value Line Geometric Index, Wilshire 5000, and NYSE Composite Index in the following chart, we see the same breakout pattern as we had in the S&P500.
Source: Refinitiv Workspace
Outside of the United States, global stock markets similarly broke out. Note the following chart with examples of the MSCI World Price Index and MSCI Europe, Australasia, and Far East (EAFE) demonstrating similar breakouts at the time.
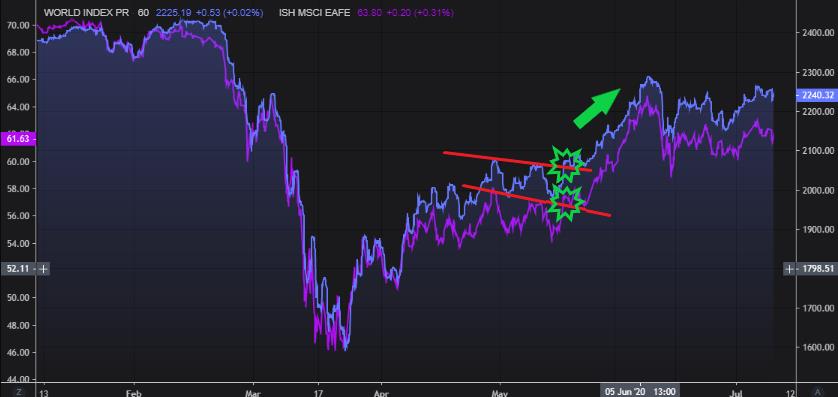
Source: Refinitiv Workspace
Moreover, we saw concurrent breakouts by various sectors that would be expected to be specifically impacted by the economic damage wrought by the pandemic. Note the following chart of the Dow Jones Transportation Average, a good proxy for transportation related names.
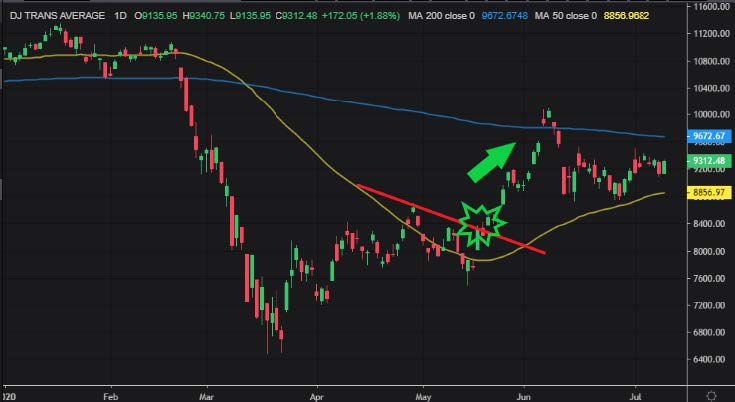
Source: Refinitiv Workspace
Furthermore, while the overall markets’ initial move off the March low looked to have been driven by larger capitalization companies, the kind that you would expect to better withstand the economic duress of the current recession, the breakout of the Russell 2000, a small capitalization stock index, looked to be indicative that market participants were beginning to wager on broader improvement of conditions for smaller-sized and more economically sensitive companies.
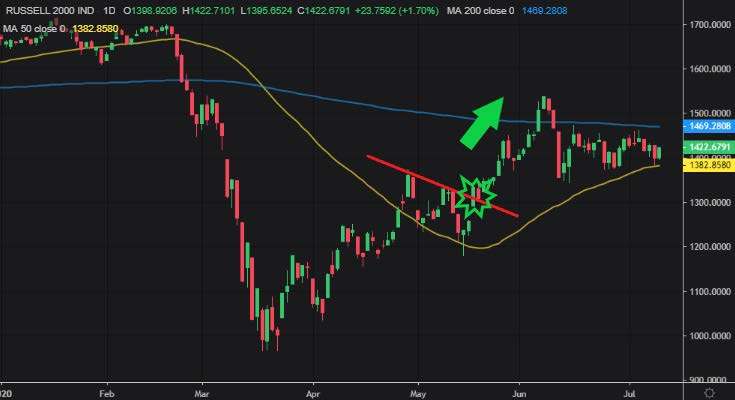
Source: Refinitiv Workspace
Can You Give Me Some Credit, Curve?
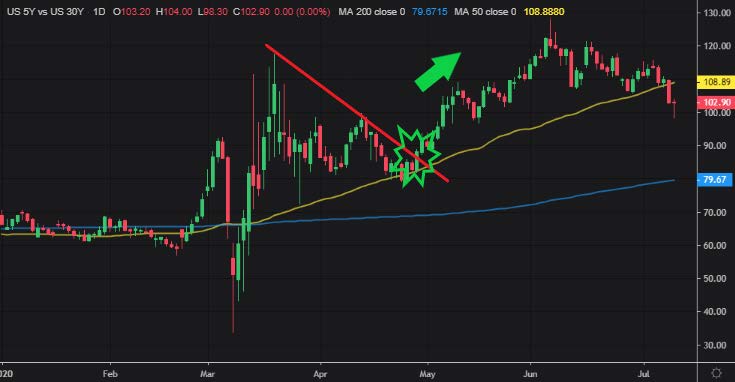
Through much of last year, we had sounded like broken records pointing to the inversion of much of the yield curve as a clear signal of economic weakness we expected ahead in 2020 and justification for our ratcheting down of equity and corporate credit exposure in a transition to a broadly risk-off posture across our models. Now we find the reverse occurring, with the yield curve generally steepening, providing us a strong signal of renewal of the business cycle.
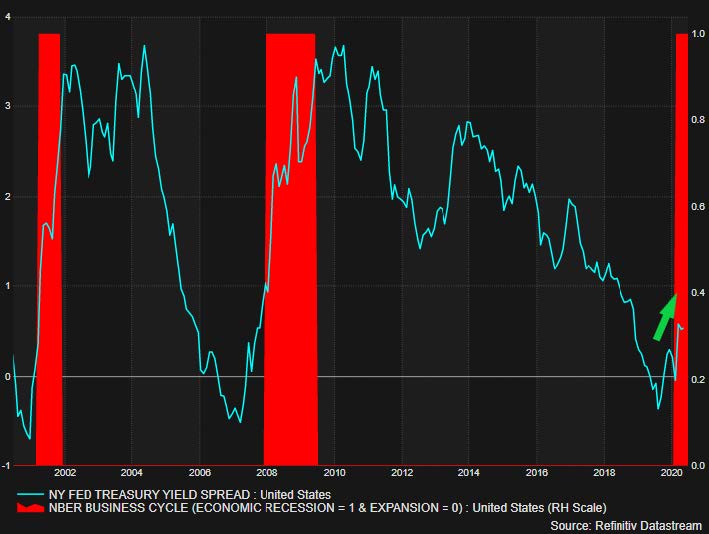
This generally constructive shift in the shape of the yield curve was punctuated by its decisive steepening in May, a pattern often considered a positive for financial institutions and a barometer of constructive credit conditions, which seemed to correlate with other equity market signals we have laid out.
In the following chart we see the US5s30s, the spread between the interest rate of the 5-Year and 30-Year Treasuries, to take just one spread as an example, break out of a consolidation since March and then steepen in well-defined trend.
Source: Refinitiv Workspace
King Dollar
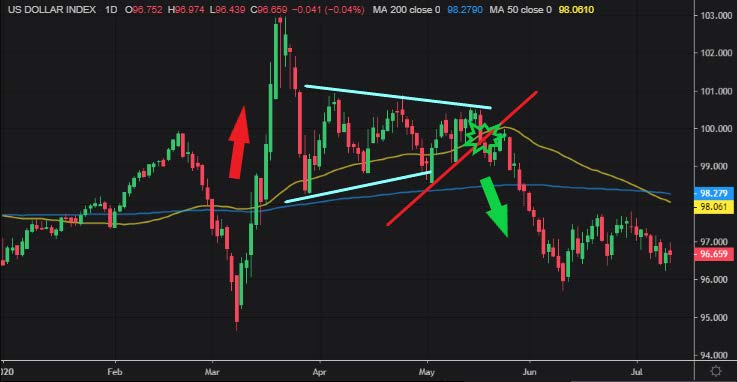
Lastly, we would cite the importance of the United States Dollar’s (USD) behavior, due to its reserve currency status and Eurodollar impact on global liquidity, as another useful barometer of investor sentiment. As highlighted in the following chart, the USD looked to demonstrate its general perceived risk-off characteristics, when in March it surged violently as investors sought safe-haven assets such as U.S. Treasuries and global liquidity tightened. Upon the announcements of dramatic and coordinated global fiscal and monetary interventions in late March, we then saw the USD come off its highs in a signal of loosening financial conditions and calming of investor fears.
However, much as we had cited as a reason for our continued caution from March to the beginning of May, the USD held in a trading range (similar to some degree to the S&P500 in that same period) that signaled to us no clear direction on how markets would break as they digested the steady drumbeat of negative pandemic and economic news. That indecision ended in late May, as the USD clearly broke lower out of this consolidation range and signaled to us that global liquidity and financial conditions were now on an improving trend.
Source: Refinitiv Workspace
Central Banks to the Rescue
So here we write to you now, roughly three months after our last commentary piece, with over half a million dead and over twelve million confirmed cases from COVID-19 global, civil unrest having gripped much of the U.S. and parts Europe, and tens of millions of workers now jobless globally, and yet global equity markets have generally reclaimed much of their losses year-to-date. Bucking what we had cited as historical precedents, global equity markets (and corporate credit) seem to have indeed looked through the economic, earnings, and balance sheet carnage of the worst disruption in business activity in modern history.
The reasons why the market seems to have shrugged off these realities so far will surely be debated amongst market participants for years, but in our minds the likely overriding reason is something we highlighted in our last piece; rapid and substantial fiscal support across many of the world’s largest economies coupled with historic amounts of liquidity and monetary intervention in primary and secondary asset markets by global central banks and the U.S. Federal Reserve, in particular. In fact, one could say that the two are now essentially intertwined as new government debt issuance to finance the vast deficits fiscal authorities are facing has been at least partly absorbed by reserve creation in our likely first tastes of Modern Monetary Theory (MMT) and true “Helicopter Money.”
The latter factor of central bank intervention, especially the U.S. Federal Reserve’s actions, is one that bullish market participants have often cited in particular over the past decade since the Great Financial Crisis (GFC), as the implicit safety net provided by monetary authorities to risk assets and more specifically equities. However, we have felt that a common expression heard on Wall St. of “Don’t fight the Fed” was a somewhat intellectually lazy argument, as it did not capture all the nuances of how their policies affected secondary markets.
There are forecasts that the U.S. Federal Reserve will hit the U.S. economy with a wall of liquidity that should essentially double their reserve assets by next year. This, as per the chart below, shows the increase of reserve assets have demonstrably clear correlation with the S&P500’s price performance. But if much of these new reserves are going to be mopped up by new debt issuance from the U.S. Treasury (essentially MMT), what amount would be indeed left over to absorb secondary market assets and walk investors up the risk ladder?
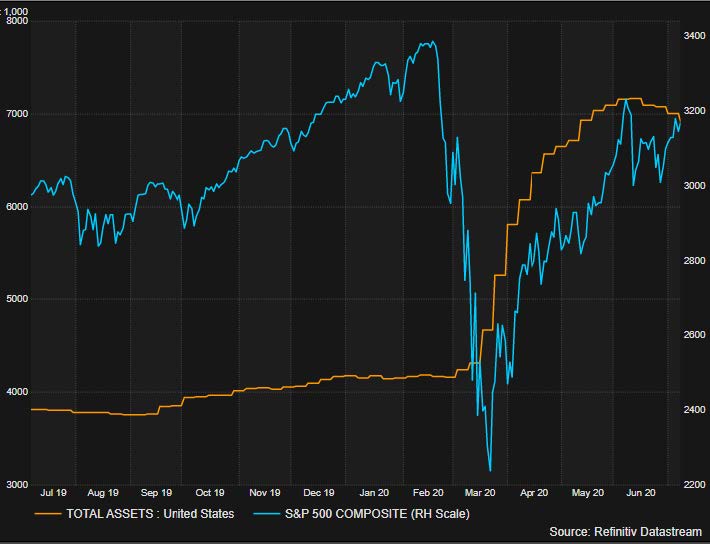
Well, if to answer that in saying that even the most well-worn cliché probably has a nugget of truth at its core, the fact that global markets’ seemed to have bottomed in March almost exactly to the day that the Federal Reserve announced that it was crossing into uncharted territory by expanding its Quantitative Easing programs into the realm of corporate bonds should put paid to that notion. Even more interestingly to us, this was also coupled with The Federal Reserve’s first tiny foray into likely an inevitable migration into buying equities directly, a la Bank of Japan (BoJ), through the purchase of exchange-traded-funds (ETF) that own corporate bonds.
This specific change in their mandate seemed to have had the intended impact of rapidly and dramatically tightening corporate credit spreads and likely staving off however many publicly listed corporate bankruptcies that would have resulted without intervention. Some could argue that this is pure moral hazard in preventing economic and market fundamentals from properly asserting themselves and essentially socializing our capital markets. Others may claim that is was a necessary stopgap measure to loosen financial conditions enough to allow public companies enough breathing room to survive until the recovery from the pandemic. Either way, it had, in our opinion, the intended effect of coaxing public asset prices to essential ignore fundamentals and kick off a rally that now looks to be, in hindsight, the first leg of a brand-new bull market that started in March.
Surprising Economics
With the torrid rally since March, what are markets pricing in? Recovery, by the looks of it. Though it does seem ludicrous to see the markets head towards their old highs in the face of potentially the worst economic devastation since the 1930s, one thing we often remind our clients is that we should often see market price trends as derivatives of changing expectations and flows, not a static reflection of the present. So. while current conditions seem gloomy, the rate of change of economic change does indeed look to be improving across a broad series of metrics.
Citing the U.S. once more, simply looking at the following Citi U.S. Economic Surprise Index, one can see a dramatic improvement in economic surprises since the May trough. This data point is similarly seen in the global index.
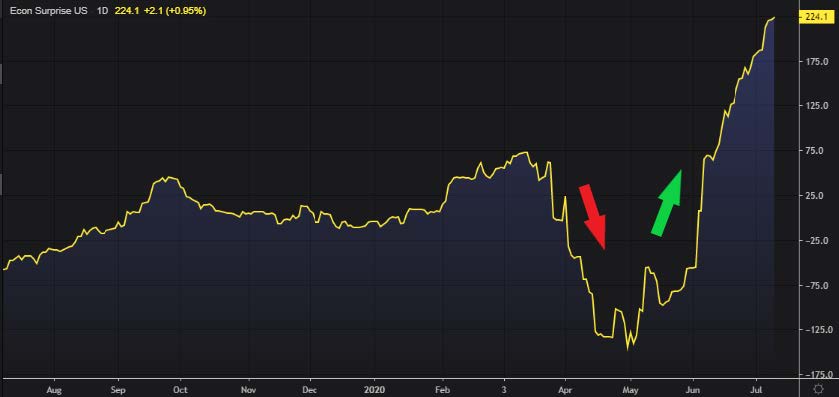
Source: Refinitiv Workspace
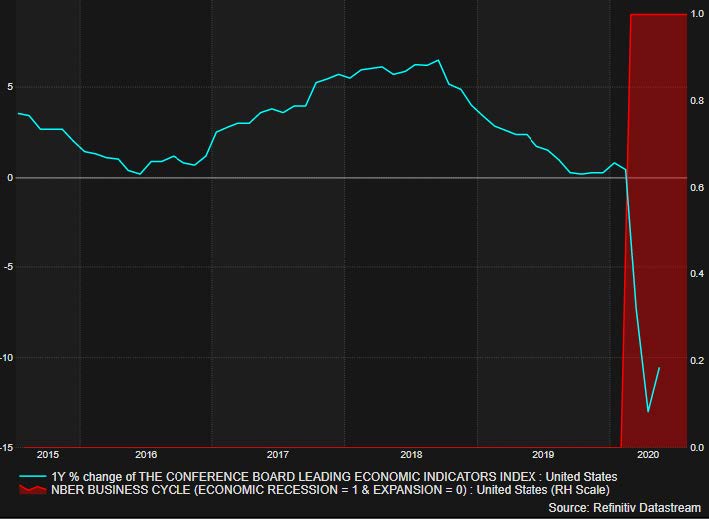
Another favored metric that we have often cite to clients is the Conference Board Leading Economic Indicators (LEI) Index, which similarly demonstrates an apparent bottoming back in May (the most recent data point available right now) and should likely show a continued rise for June in the July data release.
An obvious retort to this cautious optimism is the fact there are still an enormous number of unemployed that the lockdowns from the pandemic have caused. Moreover, since many of these jobless worked in hospitality or retail, there appears to be a high likelihood that many will remain out of work due to continued social distancing measures that will likely be in place for some time to come. Not to mention the ensuing systemic risk this may pose longer term due to rising loan delinquencies and bankruptcies.
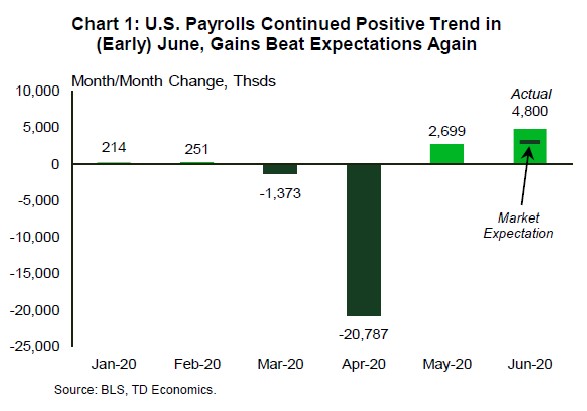
These are valid points and we can appreciate that long term structural unemployment would likely have an impact on worsening the economic output gap, but there does seem to be improvement on the employment front when looking at declining continuing jobless claims (equivalent of employment insurance claims here in Canada) and steady increases in monthly payroll numbers here in Canada and the U.S, if not globally.
In our minds, one positive about this recession, if there ever can be anything good about them, is that it was the product of government fiat to cease large swaths of economic activity as opposed to the result of massive overinvestment or structural imbalances much like we in the GFC. That could imply that any economic damage can be more quickly reversed by lifting government edicts as opposed to the more painful and slower recovery that is associated with working off asset and debt imbalances.
During this recession, fiscal authorities seemed to have been much more amenable to opening the purse strings to compensate households and businesses for the economic pain that their lockdowns have caused. Certainly, it is a big hole to dig out of, but the unemployment situation looks to be improving and interestingly enough, if the concern surrounding high levels of unemployment is its ultimate impact on household balance sheets and consumption to support economic output, then the following chart should be quite illuminating.
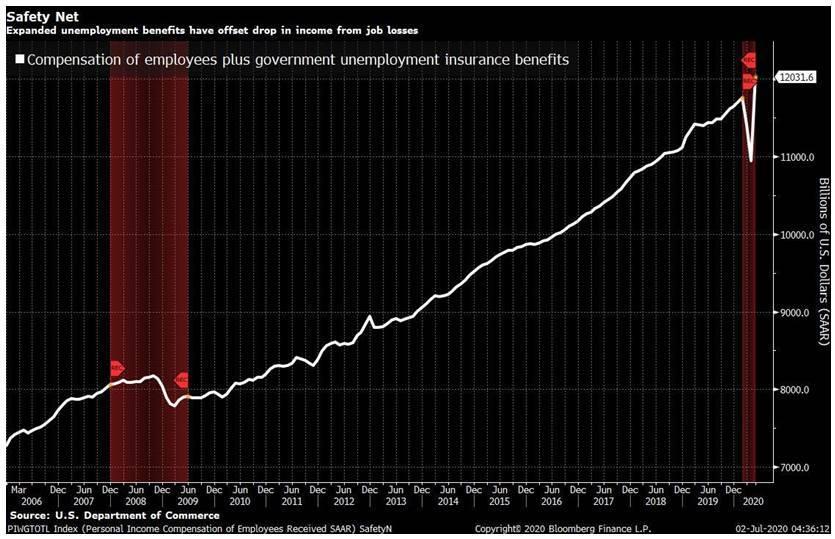
Source: Refinitiv Workspace
Despite the enormous job losses incurred from the lockdowns and social distancing measures, total compensation for U.S. workers and unemployed has increased during pandemic due to these fiscal support measures. Perhaps markets are taking solace in this fact as it may keep consumption from falling too much and may stave off more loan delinquencies than feared. Perhaps as long as governments can continue step into the economic and fiscal breach if lockdowns were to persist, that may save us all from the more dire economic outcomes that were once feared.
No Shortage of Risks
With respect to our models’ asset allocations and risk posture, three major risks are at the forefront of our thinking.
Firstly, and obviously, the spread of the virus SARS-CoV-2 and the impact of its attendant disease COVID-19. Notwithstanding the current debates around which jurisdictions have done a better job of suppressing the spread of SARS-CoV-2 and which have better managed the impact on their healthcare systems, there is still much that is unknown about the pandemic’s true extent. There have been a handful of studies performed from serology samples (the Canadian government will be releasing results of its own sample later this month) that have indicated that the extent of the population showing antibodies to the virus are multiples of 10x the number of confirmed cases. This would make sense given the very limited testing that was available in most jurisdictions when the pandemic first took hold. If this is true and is more generally confirmed by further studies, it will imply that the spread of the virus has been far greater than previously known, with many more infected that are asymptomatic.
Moreover, this would imply that the morbidity and mortality rate from contracting SARS-CoV-2 might be quite different than what was previously feared and could impact public policy around how to respond to a second or more waves. The disastrous COVID-19 situations experienced in Wuhan and its surrounding Hubei province, Italy, Spain, Iran, and the Tri-State region in the first half of the year may have been the result of the virus spreading amongst their populations unencumbered in the months prior to any social distancing, infecting significant percentages of the local populations, and thus was able to easily swamp these regions’ health care systems.With some degree of social distancing and protections likely to be a fact of life for most countries’ immediate futures, there is cautious optimism that the future spread of the virus could be better managed without the enormous economic consequence of full lockdowns like we saw in early spring.
What we would deem as the greatest danger to risk assets would likely be the impact of a repeat of the spring’s broad economic shutdown, so our reaction function to that risk would be less driven by the number of positive cases, which to some degree is the product of rapidly increased testing and sheer ease this virus seems to be able to spread through asymptomatic carriers, than data such as hospitalization, intubation, and mortality rates. It was ultimately these latter factors, especially as they gripped the developed world’s attention in the plights of Italy and NYC in early spring, that likely drove the drastic responses of Western governments in March.
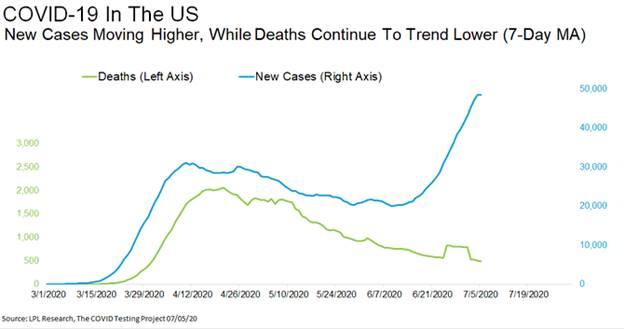
Today, some of these same fears are being roused once more in the surges of cases in the sunbelt of the U.S. and touted as evidence of the renewed risk from the virus from a second wave. However, we would suggest that one should look past the increase in positive cases, to see if they have the corollary impact on number of deaths. Looking at the chart below, comparing the number of new COVID-19 deaths per 100,000 people in Texas and Florida against New York, one can see that new COVID-19 deaths related to this recent resurgence in those two southern states barely even registers against what New York went through.

Source: Refinitiv Workspace
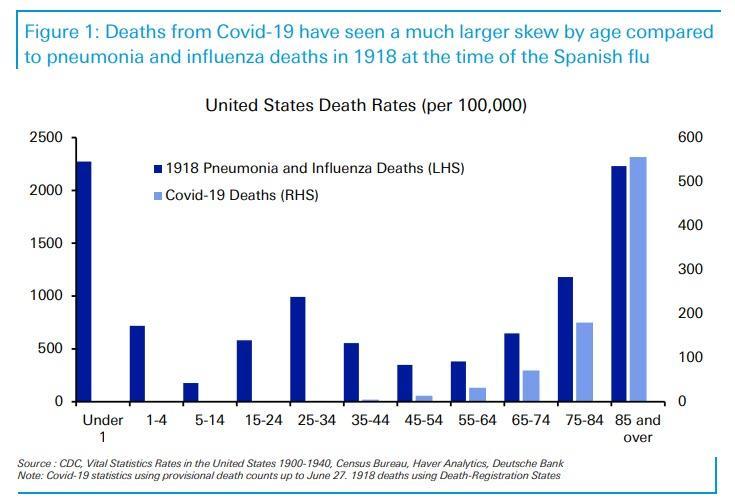
This perspective is reinforced by statistics that highlight the recent resurgence in positive cases nationwide, mainly driven by southern states, has not been followed similarly by deaths. Even when factoring for the time lag that is normally associated between the two, there does not appear to be the same mortality rate, or at least so far, for the virus as had been seen in early spring.
Whether this is the result of the changing demographics of the infected (skewing younger and healthier), better therapeutics, more hospital capacity, or simply the fact that testing is much more prevalent than it once was, we are sure each side in the debate will come up with interpretations that benefit their arguments.
Regardless, it will be the mortality rate, framed against the hospitalization rate and authorities’ reaction to it relative their modulating phases of economic re-opening that will drive our assessment of the risks and any consequential changes to our asset allocation and risk posture.
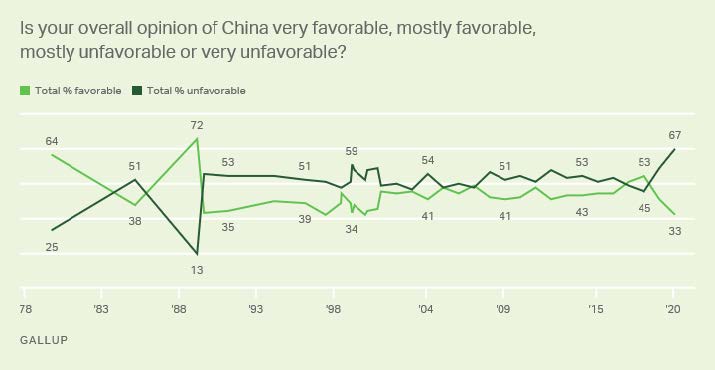
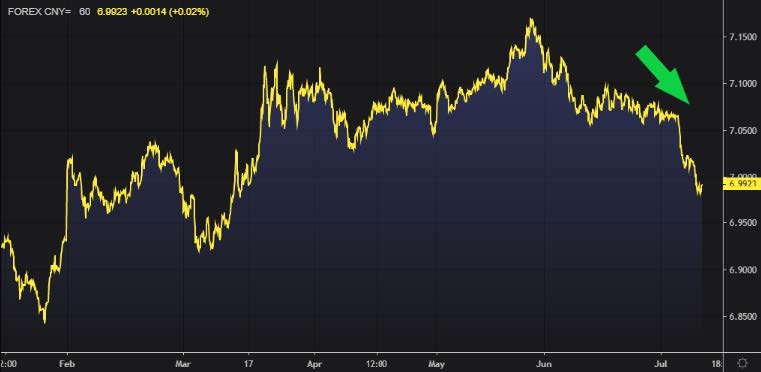
The second risk that is on our radar is political tensions between China and the United States and its ensuing impact on bilateral trade relations and global risk sentiment. With President Trump appearing embattled from his administration’s response to the pandemic and the strong likelihood that the economic output gap and elevated unemployment level in the U.S. will persist into the fall election, we are vigilant to the risk that his administration could go to some lengths to stoke tensions as a red herring to distract voters. The risk of this ploy is elevated given that from recent polling there appears to be a sizeable negative shift in perception amongst the broader American electorate towards China from not only recent developments in Hong Kong but also related to the origin and handling of SARS-CoV-2 by the Chinese Communist Party (CCP).
Source: Refinitiv Workspace
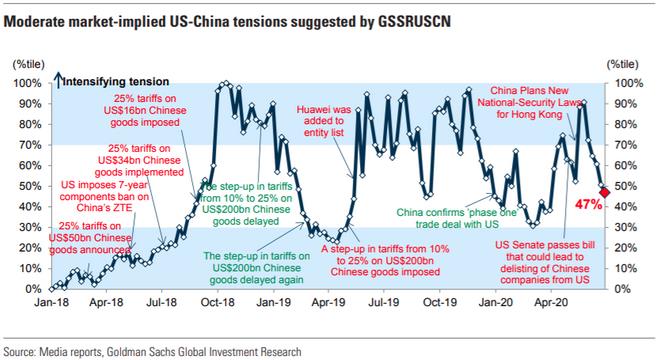
Back in May, this negative trend in relations seemed to come to a head with the CCP’s National People’s Congress announcing their intention of passing a national security law that was to supersede Hong Kong’s Basic Law, the legislative structure of Hong Kong’s self-governance that was perceived as the underpinning of the One Country, Two Systems framework that outlined the city’s international relations. Contrary to some expectations for a swift deterioration of relations, somewhat highlighted by the very hawkish rhetoric from Secretary of State Mike Pompeo, President Trump wound up announcing what seemed to us a relatively tepid response that looked to be a walk back from a real escalation. Furthermore, this apparent de-escalation was reinforced by various market-implied measures and, most accurately in our eyes, the CNYUSD exchange rate.
Source: Refinitiv Workspace
Therefore, we feel that the risk of deteriorating Sino-American relations should be subdued until after the U.S. election. However, we would expect that in 2021, given the apparent growing Beltway consensus to move to a Cold-War like stance of containment of China and decoupling of “Chimerica” trade and corporate connections, there will likely be renewed tensions regardless of who wins the White House.
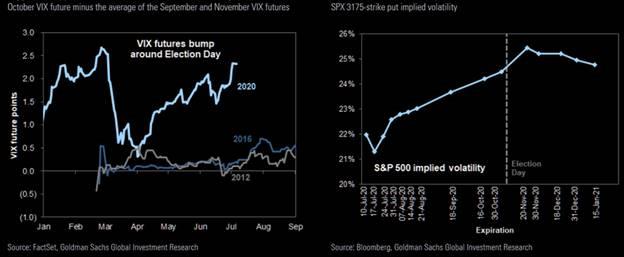
Speaking of the U.S. elections, that takes us to our third major risk we are watching into year-end. There appears to be some consensus amongst the investing community that a Biden presidency would be negative to U.S. corporate earnings given some of the rhetoric his campaign has promulgated, especially with respect to the risk of a rollback of the corporate tax cut enacted by the GOP in 2018. Measures of future pricing of volatility are indicating greater premiums around the fall election, per the following chart.
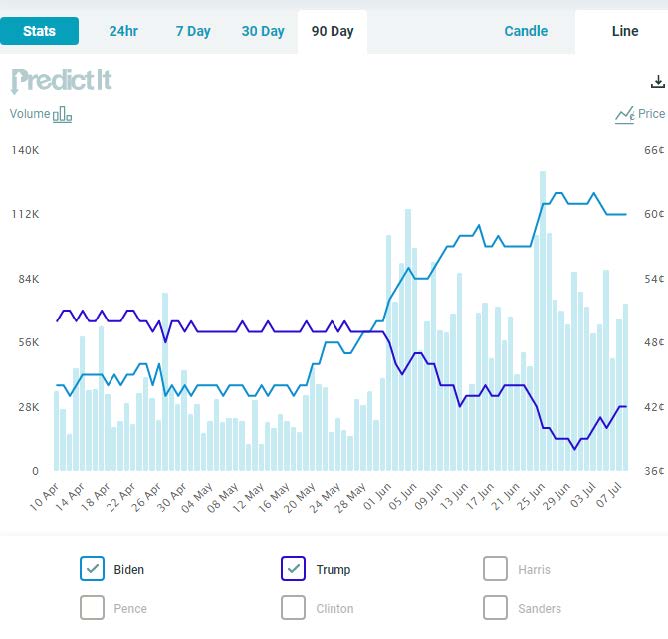
Given the potential inaccuracy of presidential polls, especially seen in 2016 with polling showing Clinton as a strong favorite to win that election, many in investing circles have tended to look at betting sites as perhaps a more intuitive means of ascertaining the true political winds of favor, as they rely on punters putting real money on their calls as opposed to surveyed voters potentially lying about their support for any candidate. One well known betting site, PredictIt, shows a material lead for Biden with roughly a 60% likelihood of winning the presidency.
Source: Refinitiv Workspace
Some markets pundits have ascribed the small pullback the market experienced in June to the jump in Biden’s prospects in that same time period. To us, the long-term implications of a Biden presidency to markets are not so clear, given that Democrats have not exactly been anathematic to corporate interests when in power (they have donors too). However, should this election cycle result in a sweep of both chambers of Congress, the lack of a Republican brake in the Senate on more anti-corporate agenda items that would be brought forwarded by an activist Democratic House of Representatives could indeed pose a danger to risk assets. We will be monitoring the situation closely into the fall and adjust our asset allocations and risk posture accordingly, especially if a sweep looks very likely.
Wall of Worry
In our meetings over the recent months, we have often heard clients describe the current state of the world in terms of strange days and times. When describing the pandemic, the governmental response, and the economic impact of the resultant lockdowns, the many superlatives ascribed do not seem to do justice to how the events of this year so far have made us feel. Fear and anxiety abound, but these have traditionally been useful tools for investors, as markets have often had a penchant for climbing walls of worry. We have always felt that it is often complacency, especially during times of plenty and invisible threats, that pose the greater danger to investors.
In the following chart, we can see fear manifested in the decision of market participants to park more cash into money funds than they had done during the GFC.
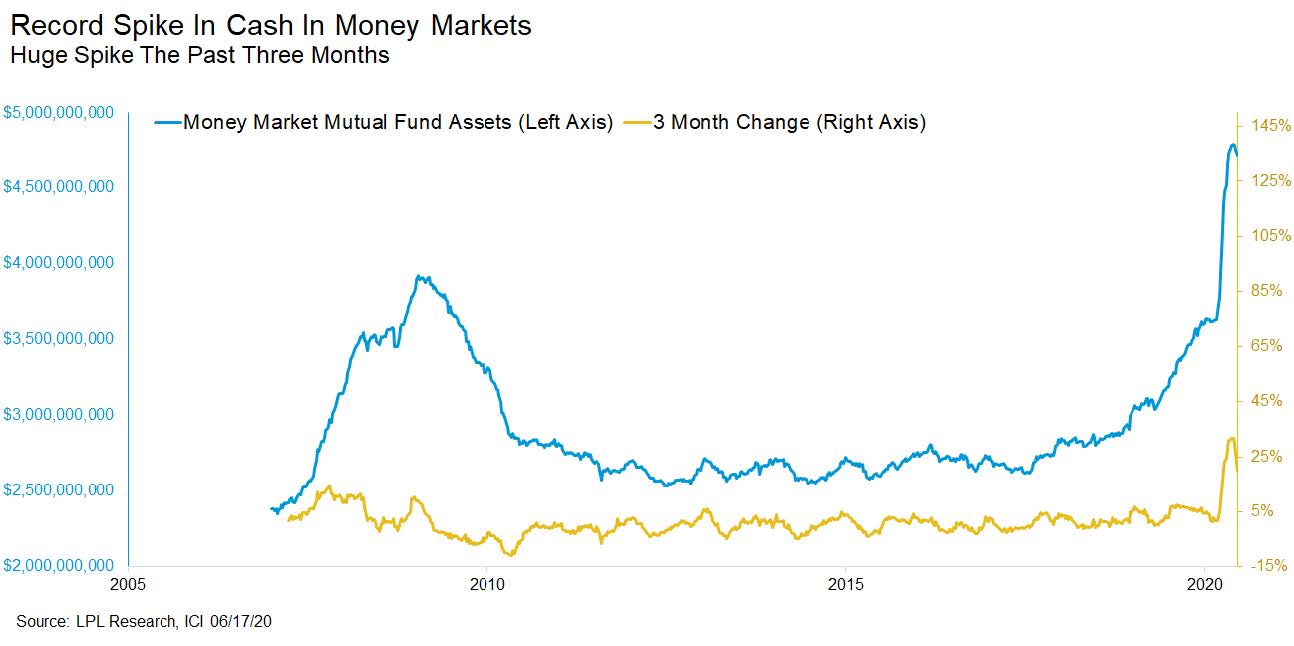
After numerous market and economic signals provided enough evidence in late May that we needed to adjust our asset allocation and risk posture in our models to embrace the incipient recovery, we have embraced a cautiously optimism and bullish stance with respect to risk assets. We look upon this prior chart of cash held in money market funds as a point of solace and reassurance, as it represents to us the fuel which can propel risk markets into the future.
Wishing you happiness and good health.