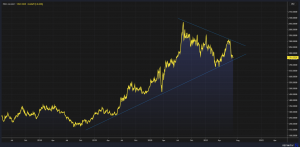
Having suffered a nearly decade-long bear market through much of the 2010s, gold began a blistering ascent back in late 2018, having essentially doubled in price by its most recent peak back in September of last year. We initially took on our full precious metals exposure in the Growth and Aggressive Growth models back in 2019, but looked to take advantage of the correction in that market in the Fall of last year to introduce exposure to the Balanced model. Needless to say, it has been a somewhat frustrating position since, notwithstanding its attractive portfolio diversification benefits, as it has continued to hug the multi-year bull trend support line, without a clear reassertion of its prior bull trend.
That said, when looking at a larger chart, there does seem to be a well-known consolidation pattern forming called a Symmetrical Triangle pattern. Though there is never such a thing as certainty in markets or the study of them through Technical Analysis, there has been ample precedent that when an asset’s price has been previously bullish trending, as gold had been from late 2018 to mid-2020, and this asset consolidates into a Symmetrical Triangle pattern, then its price performance has often resolved itself in the same direction as its trend prior to the consolidation. In this case, a resumption of gold’s bull market with a strong possibility of a powerful breakout from the pattern. The risk is always that it might resolve the consolidation in the opposite direction, which may prompt us to reevaluate our desire to maintain the position as the market may be telling us something through price that perhaps the fundamentals have yet to. We will stay long for now.


