Using our proprietary investment process, we seek strong, absolute returns in all market environments to constantly outperform over time. We adapt to changing markets through hard work and an objective to grow our clients’ wealth. We endeavour to control losses as a core investment style, shown by our rare negative years.
Net of fees, as at December 31, 2024
| YTD | 1 Year | 2 Year | 3 Year | 4 Year | 5 Year | 10 Year | Annualized Return Since Inception |
Cumulative Return Since Inception |
|
|---|---|---|---|---|---|---|---|---|---|
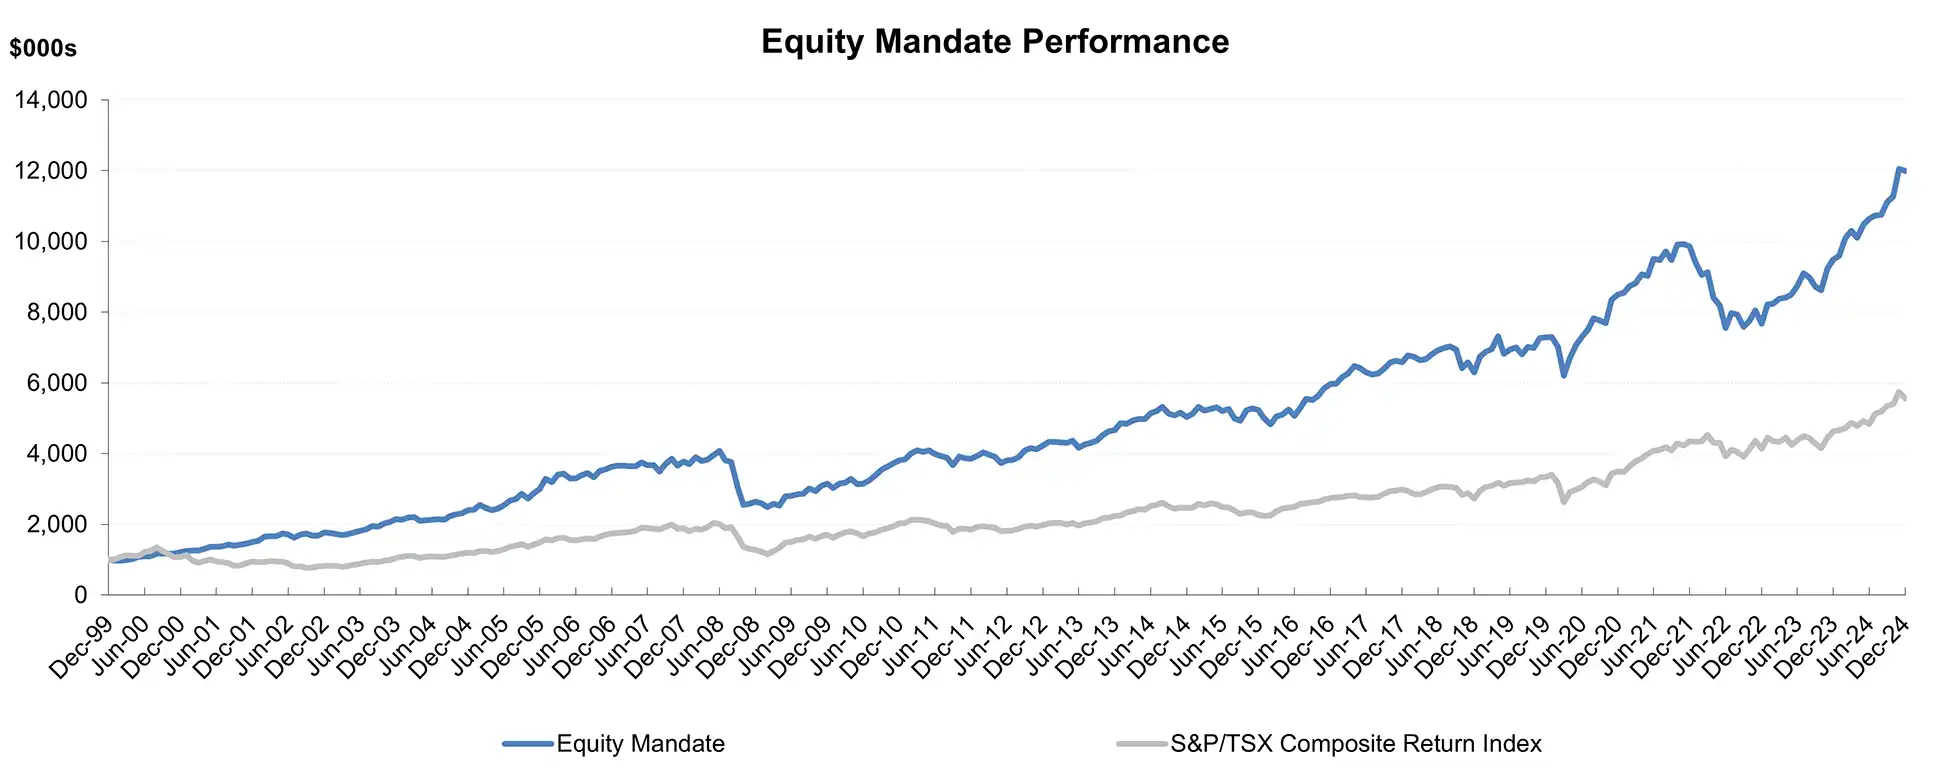
| Equity Mandate | 26.3% | 26.3% | 25.1% | 6.8% | 9.0% | 10.5% | 9.1% | 10.4% | 1099.6% |
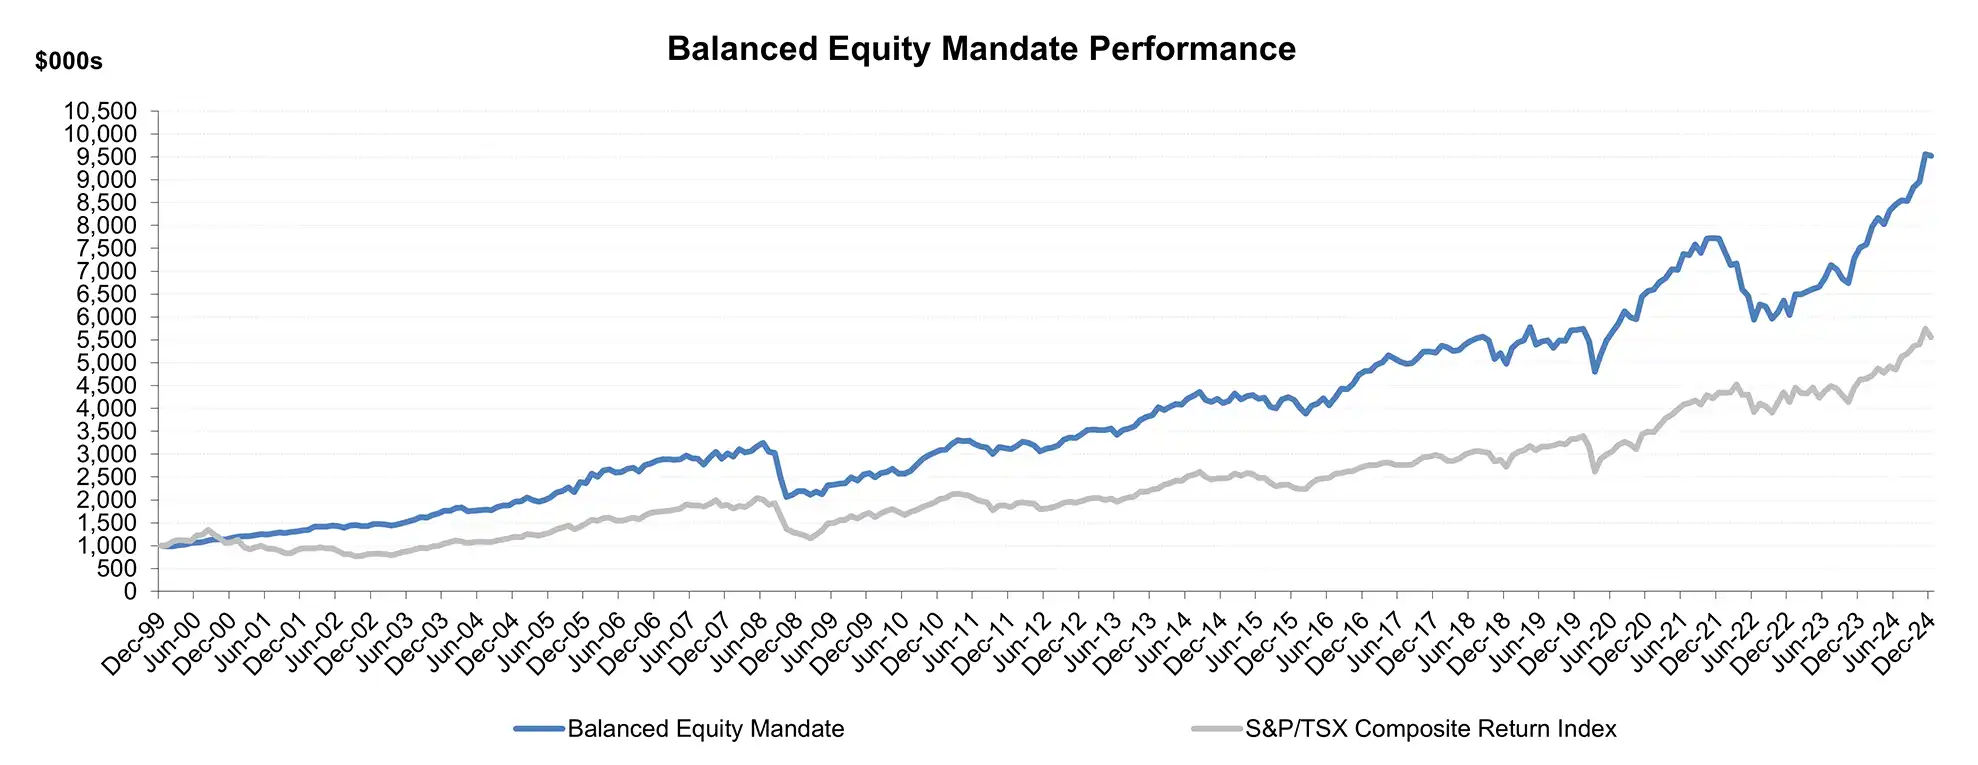
| Balanced Equity Mandate | 26.7% | 26.7% | 25.6% | 7.3% | 9.7% | 10.7% | 8.8% | 9.4% | 852.0% |
| S&P/TSX Composite Index | 21.6% | 21.6% | 15.8% | 8.5% | 12.3% | 10.7% | 8.5% | 7.1% | 455.7% |
Based on initial investment of $1MM
Based on initial investment of $1MM
Net of fees
| 2024 | 2023 | 2022 | 2021 | 2020 | 2019 | 2018 | 2017 | 2016 | |
|---|---|---|---|---|---|---|---|---|---|
| Equity Mandate | 26.3% | 23.8% | -22.2% | 16.0% | 16.6% | 15.7% | -4.3% | 10.4% | 14.0% |
| Balanced Equity Mandate | 26.7% | 24.5% | -21.7% | 17.5% | 14.8% | 14.8% | -4.5% | 8.2% | 15.1% |
| S&P/TSX Composite Index | 21.6% | 11.8% | -4.9% | 24.5% | 4.6% | 22.8% | -8.9% | 9.1% | 21.1% |
| 2015 | 2014 | 2013 | 2012 | 2011 | 2010 | 2009 | 2008 | |
|---|---|---|---|---|---|---|---|---|
| Equity Mandate | 3.7% | 8.0% | 10.3% | 9.9% | 1.1% | 21.1% | 19.4% | -30.4% |
| Balanced Equity Mandate | 1.8% | 6.7% | 12.2% | 10.4% | 0.8% | 19.5% | 17.7% | -27.2% |
| S&P/TSX Composite Index | -8.3% | 10.6% | 13.0% | 7.2% | -8.7% | 17.6% | 35.1% | -33.0% |
| 2007 | 2006 | 2005 | 2004 | 2003 | 2002 | 2001 | 2000 | |
|---|---|---|---|---|---|---|---|---|
| Equity Mandate | 4.4% | 20.9% | 25.2% | 11.8% | 21.4% | 18.3% | 23.6% | 20.7% |
| Balanced Equity Mandate | 5.8% | 20.4% | 20.9% | 10.6% | 20.1% | 10.3% | 14.2% | 16.9% |
| S&P/TSX Composite Index | 9.1% | 17.3% | 24.1% | 14.5% | 26.7% | -12.4% | -12.6% | 7.4% |