Dow at One Million?
When the Dow Jones Industrial Average (Dow) crossed a new high of 40,000 in May, it achieved a milestone that appeared implausible given recent popular sentiment. Just two years earlier, central banks were still on the path of aggressively hiking rates to curb inflation. Gloomy equity market forecasts abounded. Fast forward to today, and interest rates remain higher than anticipated. Many valuation models use interest rates to discount future cash flows: higher rates lower a company’s future earnings and put downward pressure on stock prices. Alongside slower economic growth and high debt levels, the future has appeared cloudy through many lenses. Yet, markets can often be confounding.
From an economic perspective, this period has been described by some as a liminal space, a transition between ‘what was’ and ‘what’s next’ — a sort of “in-between” economy that’s neither great nor terrible. It’s a fair observation and perhaps explains why financial narratives seem varied and shifting. In December, many market observers believed we had inflation in check; yet the anticipated rate cuts did not largely materialize in the first half of the year — the Bank of Canada was the first G7 central bank to reduce rates in June. To preserve credibility, central banks have been moving cautiously after being criticized for their slow response to rising inflation; the consequences of the 1970s still loom large.
Nobody wants a repeat of the 1970s, a time when inflation persisted for an entire decade
at an average of 8 percent per year, alongside high unemployment, or stagflation.1 It was only when then-Fed Chair Paul Volcker raised rates to a whopping 20 percent by 1981 that inflation would be conquered, but not without significant pain. Today, labour markets remain resilient amid easing inflation — an enviable outcome. Consider that inflation and unemployment traditionally exhibit an inverse correlation, and multiple studies suggest that higher unemployment depresses our well-being more than inflation, in some cases up to five times as much!2
Where are economies and the financial markets headed? Looking forward, it’s worth recounting a prediction made by renowned investor Warren Buffett years ago: Expect the Dow to reach one million in 100 years.3 At first glance, this may seem like quite the assertion considering the Dow hovered at a mere 100 points just 100 years ago.4 However, looking deeper at the numbers, the Dow needed to compound at less than 4 percent annually to achieve Buffett’s target at that time. Today, the S&P/TSX would need an annual return of 4 percent to reach 1,000,000 by 2124.
Yet, Buffett’s intent wasn’t to propose whether an arbitrary benchmark could be achieved. Rather, he meant to inspire confidence in future growth. History has shown that equities outperform most asset classes over time; not surprising given the general upward trajectory of corporate profits. This doesn’t imply that there won’t be challenges along the way — today, there are many. Yet, we continue to overcome these challenges because one thing hasn’t changed: the human condition to advance and grow. As investors, we shouldn’t lose sight of the growth yet to come, and we can all benefit should we choose to participate. We are here to provide wealth management strategies and support to navigate this liminal space — as we progress toward the one million mark.
We hope you will find some time to relax and rejuvenate this summer. As always, we remain here to support any investment needs.
1. https://www.bankofcanada.ca/2019/02/price-check-inflation-in-canada/; 2. https://www.wsj.com/articles/inflation-and-unemployment-both-make-you-miserable-but-maybe-not-equally-11668744274; 3. https://www.cnbc. com/2017/09/21/dow-1-million-warren-buffett-says-it-can-happen.html; 4. http://www.fedprimerate.com/dow-jones-industrial-average-history-djia.htm
SUMMER BRINGS HOME-BUYING SEASON
FHSA or HBP: Reasons to Prioritize the FHSA
As a result of the federal budget increasing the withdrawal amount for the Home Buyer’s Plan (HBP), some clients have asked which plan is better for younger family members: the First-Home Savings Account (FHSA) or the HBP, via the Registered Retirement Savings Plan (RRSP).
As a reminder, the FHSA is a registered account that allows tax-deductible contributions and tax-free withdrawals for the purchase of a first home. Annual contributions of $8,000 to a lifetime limit of $40,000 can grow on a tax-sheltered basis. The account can remain open for 15 years. The HBP allows first-time buyers to tap their existing RRSP, subject to conditions, for a tax-free withdrawal of up to
$60,000. The amount must be repaid within 15 years; otherwise, it will be considered taxable income. Until now, the repayment period began in the second year after the first withdrawal. However, the budget has proposed to temporarily defer this start by three additional years.
Simply put, the FHSA allows holders to save and grow funds, whereas the HBP acts as an interest-free loan from the RRSP. While both can be used to purchase a first home, if funds are limited, which should be prioritized?
In many cases, the FHSA may be beneficial and here are reasons why:
1. Starting early, you may be able to access a greater amount —With both the FHSA and RRSP, starting early allows greater time for funds to grow on a tax-deferred basis. Given the FHSA’s 15-year limit, if an investor opens the account at age 18, by maximizing contributions from the outset, at a five percent annual return the account could grow to over $75,000 by age 33, more than the $60,000 withdrawal limit via the HBP.
2. Greater withdrawal flexibility — Funds can be withdrawn tax free from the FHSA for the purchase of a new home. HBP withdrawals are only tax free if repaid within a certain time.
3. Unused amounts — If not used to purchase a first home, FHSA amounts can be transferred to the RRSP. This won’t affect existing RRSP contribution room and effectively increases the overall RRSP contribution room.
Of course, the choice may be impacted by various factors, such as timing. At the end of the day, both the FHSA and the HBP, through use of the RRSP, provide excellent tax-advantaged opportunities to build wealth for the purchase of a first home. Where possible, younger folks should maximize contributions to both. If you have family members needing assistance opening the FHSA, please call the office.
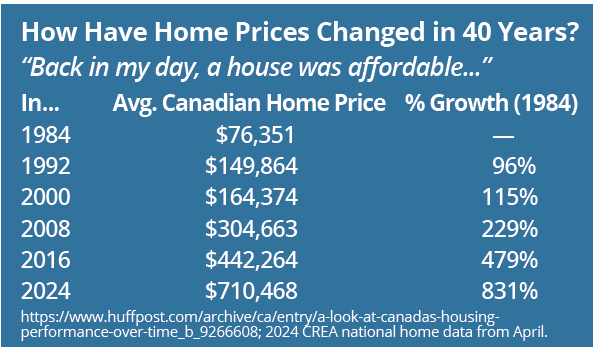
WHAT’S BEHIND OUR INCREASING EXPENDITURES?
Three Perspectives on Our Higher Cost of Living
With higher inflation, the increasing cost of living has been top of mind for many Canadians. While there has been good news on the inflation front given continuing signs of easing, here are three perspectives on our rising cost pressures.
1. Today, less of our pay cheques go to necessities. Despite a substantial rise in grocery costs, it may be surprising that the proportion of income spent on necessities has declined substantially over time. In 1961, Canadians spent 33.9 percent of family income on food and clothing; today, this has declined to just 14.6 percent. This is largely because incomes have grown faster.
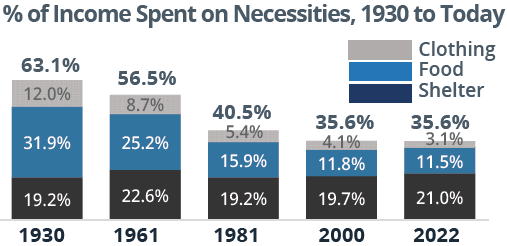
2. Which expenditure has grown the most? Taxes. According to the Canadian Consumer Tax Index, the average Canadian family spends 45.3 percent of income on total taxes, compared to 35.6 percent on necessities. Since 1961, there has been a 2,778 percent rise in the taxes we pay, outpacing increases in the Consumer Price Index (that measures changes in prices), which has increased by 863 percent.
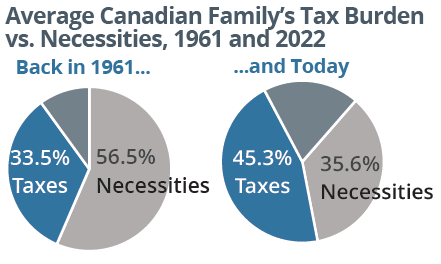
3. Higher-income taxpayers shoulder the heaviest tax burden. When comparing the share of taxes paid to the share of income, the highest income earners pay the most tax. The top 20 percent of income earners (with family income over $243,000) pay 61.9 percent of personal income taxes (PIT) yet represent 45.7 percent of total income. Every other income group pays a smaller share of PIT.
1. & 2. https://www.fraserinstitute.org/studies/taxes-versus-necessities-of-life-canadian-consumer-tax-index-2023-edition; 3. https://www.fraserinstitute.org/studies/measuring-progressivity-in-canadas-tax-system-2023
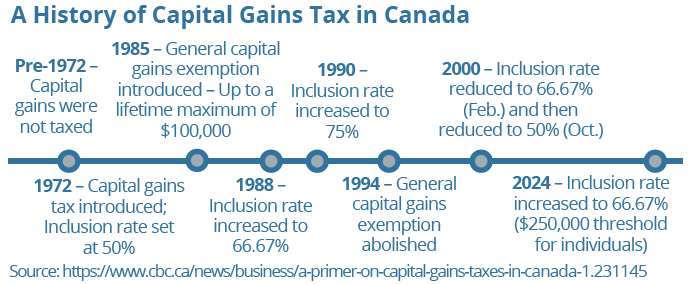
INCREASES TO THE CAPITAL GAINS INCLUSION RATE
To Defer or Not to Defer: Realizing Capital Gains
The proposed* increases to the capital gains inclusion rate have prompted some investors to ask the tax-planning question: To defer, or not to defer? Tax deferral is commonly viewed as a way for investors to create greater future returns, since funds that might otherwise go to paying tax can remain invested for longer-term growth. Yet, with increases to the capital gains inclusion rate, individuals may be evaluating the possibility of deferred taxation at higher rates against accelerated taxation at a lower rate.
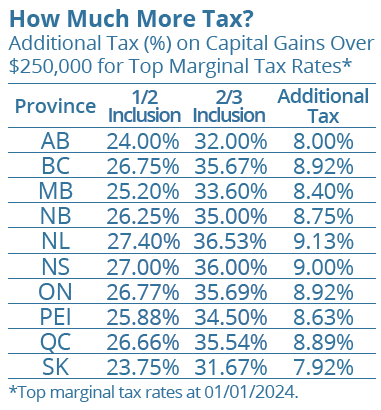
As of June 25, 2024, the capital gains inclusion rate increases from 1/2 to 2/3 (50 to 66.67 percent) for corporations and trusts, and for individuals on the portion of realized gains in the year that exceeds $250,000.
As one scenario, for a realized gain of $100,000 at a marginal tax rate of 48 percent, an investor would save $8,000 in tax by realizing a gain at the 1/2 inclusion rate, rather than realizing the gain at the 2/3 inclusion rate. However, this comes at the cost of “pre-paying” $24,000 in capital gains taxes. If this amount was instead invested in a portfolio returning 5 percent per year, it would take 9 years of tax-deferred growth at the higher 2/3 inclusion rate to beat the $8,000 in tax savings.
Here are some considerations for individual investors:
Spread gains over multiple years — Where possible, consider realizing gains over multiple years to make use of the lower inclusion rate (under $250,000) compared to a larger realized gain in a single year.
Harvest gains — Deliberately selling and rebuying stocks to trigger a capital gain may be a way to reset book value over time. This strategy is often considered for years when an investor is in a lower tax bracket, but may be used to capitalize on the lower inclusion rate each year. The decision may depend on a variety of factors such as time horizon, current/future tax rates and potential growth rate of investments.
Donate securities — Assuming the new rules apply to the deemed disposition of assets at death, if you are considering donations to support a legacy, the use of publicly-listed securities may be beneficial.
Any accrued capital gain is excluded from taxable income and a donation receipt equal to the value of the donated securities will be received. Note: For large donations other than in the year of death, the Alternative Minimum Tax may apply.
Business owners — Evaluate whether certain assets should be held in the corporation or owned personally. For corporations, there is no $250,000 threshold and 2/3 of realized gains are taxable.
Plan Ahead: For many, the increased inclusion rate will mean higher future tax liabilities. Planning ahead is important. The use of insurance or other planning techniques may help to cover a higher tax bill, such as on the transfer of a family property or on death. For business owners, the use of corporate-owned insurance or an individual pension plan may support a business’ tax strategy. Forward planning can also help access available exemptions, such as the lifetime capital gains exemption. As tax planning remains an important part of wealth planning, seek advice.
*Please note: Legislation has not been enacted at the time of writing.
A BRIEF LOOK AT INDICES
Does the Dow Matter? What’s in an Index
The Dow Jones Industrial Average (DJIA or Dow) is one of the most widely watched stock market indices and the second oldest in the world. Created in 1896 by Charles Dow, then-editor of the Wall Street Journal, it originally comprised 12 companies from traditional heavy industries, such as Chicago Gas and National Lead, giving it the name ‘Industrial Average.’ Today, the index represents 30 companies, with its composition constantly evaluated and periodically revised to include leading blue chip companies across a variety of industries.
What makes the Dow unique is that it is “price-weighted,” measured by the sum of component share prices divided by a divisor that adjusts for a stock split or dividend. In contrast, indices like the S&P/TSX Composite, S&P 500 and NASDAQ are ‘value-weighted’ based on constituent market capitalization (share price times outstanding shares).
Is the Dow a good gauge of the U.S. economy? Over its lifetime, it has faced many critics. Some argue it is too narrowly focused, while others suggest its price-weighted methodology is flawed because higher-priced stocks tend to have greater influence over lower-priced counterparts.
For example, the same price change for a lower-priced stock will not impact the index as much as that of a higher-priced stock, despite a greater percentage change for the lower-priced stock.
The Dow Today: Does It Matter?
What is particularly notable today is that the Dow’s rise may signal more robust market breadth, suggesting that recent equity market gains are not largely driven by just the technology sector. Consider that the tech sector accounts for 58.8 of the NASDAQ and 29.0 percent of the S&P 500, yet only 18.6 percent of the Dow.
Taking a broader perspective, while indices often have their limitations, they remain valuable as indicators and benchmarks of performance. The long history and ongoing advancement of the Dow Jones Industrial Average, in particular, should remind investors of the enduring trend of economic growth and continued progress
Planning for the Future:
Perspectives on Retirement Saving & Spending
“Chances are you will be the happiest you have been since you were a teenager.”
According to an article in the popular press, this is what many of us can anticipate in retirement.1 If you’re retired, perhaps you concur. If retirement is still on the horizon, the promise of retirement bliss is something to look forward to. Notably, it appears that this contentment isn’t primarily driven by financial factors. Once financial obligations are met, additional income doesn’t have a substantial impact on life satisfaction. Instead, the most significant contributors are family and social connections, along with good health.
However, there’s a counterbalance: Baby boomers are expected to enjoy historically long lifespans, but with fewer children available to provide support compared to previous generations. For some, this may pose challenges when saving for retirement. On the other hand, many retirees today are finding themselves confronted with the unanticipated financial needs of adult children who experience job loss, divorce or health issues. With a growing cost of living, buying a home and getting an education, for some, tapping the bank of mom and dad (or grandpa and grandma!) never seems to end.2
Not surprisingly, many retirees may also face a high cost of long-term care. As we work with clients, we incorporate these costs into financial plans recognizing that major lifestyle adjustments may be necessary if they aren’t adequately planned for. Another unanticipated financial shock that is never planned for is divorce. Consider that the number of divorced Canadians over age 65 grew by nearly 80 percent from 2010 to 2020.3
The good news is that we may overestimate how much we think we need in retirement. While recent surveys suggest that many Canadians think they need $1.7 million in savings,4 we may not accurately be factoring in how we will eventually draw down our retirement savings. A U.S. study shows that retirees generally exhibit very slow decumulation of assets. In fact, after two decades of retirement, retirees with half a million or more just before retirement had drawn down less than 12 percent of funds. Quite interestingly, one-third of all retirees had actually increased their assets over the first two decades of retirement.5
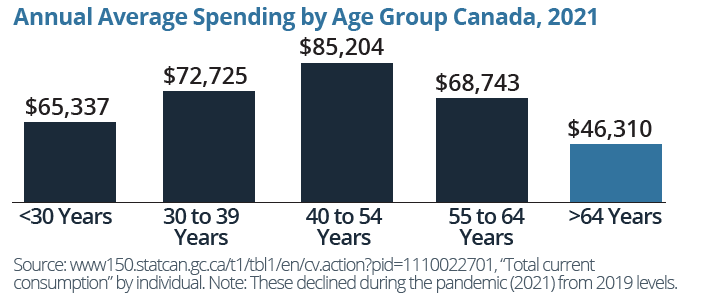
Closer to home, the latest data may support this finding: A recent report by Statistics Canada suggests that retirees have been able to maintain more of their pre-retirement family incomes in retirement.6 Consider also that our spending peaks well before retirement and declines as we get older. When we are younger, we may assume our spending habits continue at similar levels, but in most cases, they decrease. Even over the course of retirement, spending needs can substantially change based on the types of activity and level of health (see inset box, right).
One of our roles is to help you prepare for retirement and beyond, factoring these and other considerations into your wealth plan. Whatever your plans, having financial wherewithal is key. This is why we often stress the importance of giving your wealth plan the attention it deserves. Contribute steadily, stay invested and have confidence that your assets are working hard to support your future. By having a wealth plan in place, you have a retirement advantage that many Canadians don’t have. Continue to look forward — an exciting time awaits.
1. https://theglobeandmail.com/investing/personal-finance/retirement/article-happy-health-retirement-canada/; 2. https://theglobeandmail.com/globe-investor/retirement/ask-a-retiree-for-good-retirement-advice/article29557330/; 3. https://theglobeandmail.com/investing/personal-finance/retirement/article-getting-divorced-in-retirement-heres-how-to-protect-your-assets/; 4. https://www.advisor.ca/practice/planning-and-advice/canadians-now-expect-to-need-1-7m-in-order-to-retire-finds-survey/; 5. https://aspeninstitute.org/wp-content/uploads/2019/04/ebri_ib_447_assetpreservation-3apr18.pdf; 6. https://www. statcan.gc.ca/o1/en/plus/3693-golden-years-retirement-have-become-more-golden
Have You Considered the Three Phases of Retirement?
According to some retirement experts, there may be three distinct phases over the journey of retirement, where both activities and spending needs can change substantially:
Phase I: The Go Years. “Unshackled” from daily working life, retirees tend to enjoy this new-found freedom by spending time and money on such things as travel or hobbies. In this phase, discretionary spending may be higher as retirees fully indulge.
Phase II: The Slow Years. As the body slows down and the desire for travel or other activity wanes, consumption of discretionary items and the associated costs generally recede.
Phase III: The No-Go Years. Physical ability may become impaired due to “silly accidents,” declining health or just a natural slowing due to age. In this stage, medical costs may increase; some significantly, including a potential need for long-term care.
https://www.theglobeandmail.com/globe-investor/retirement/retire-lifestyle/budgeting-for-three-phases-of-retirement-keeps-spending-on-track/article27317510/