They say, “patience is a virtue.” I say, “If we have to wait, we better be paid to wait.” That is what Canadian oil offers today: high dividends in a year when share prices for producers have been flat. We added to our positions in September (see red circle on Oil chart below) when it looked like the bottom was in for oil, only to be disappointed as crude slipped below 60 dollars in October. This week we explain why our view is unchanged and why getting paid to wait sets up 2026.
A Year of Contrasts
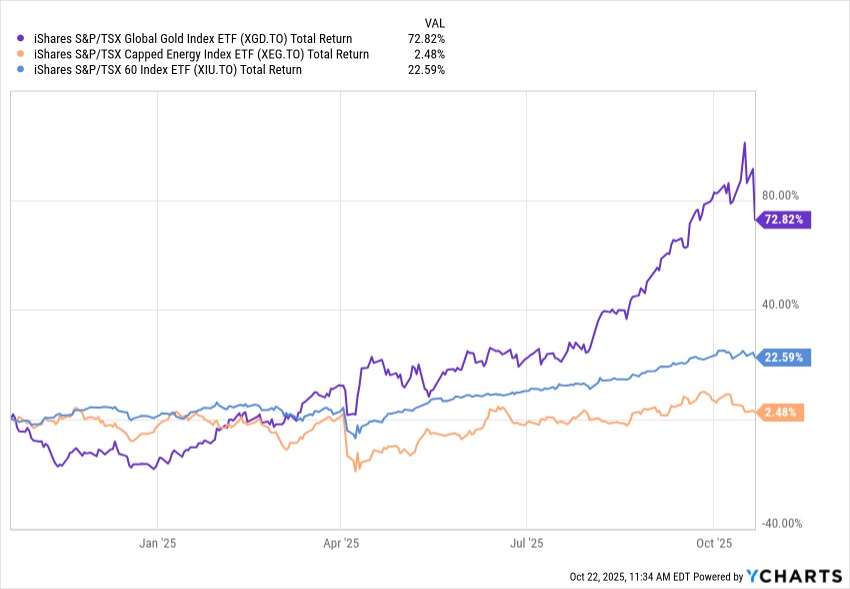
YCharts.com © 2025 YCharts, Inc. All rights reserved
Over the last 12 months to October 21, gold is up about 72.8%, the TSX is up about 22.6%, and the Canadian energy index is up a meagre 2.5%. Good investors prefer to shop in the “discount” aisle. This kind of price divergence is particularly appealing to long term investors.
September was strong. Oil rose toward 70 dollars and Canadian energy stocks moved higher. But in October, oil fell back to the high 50s and energy gave up most of those gains. Sentiment flipped quickly.
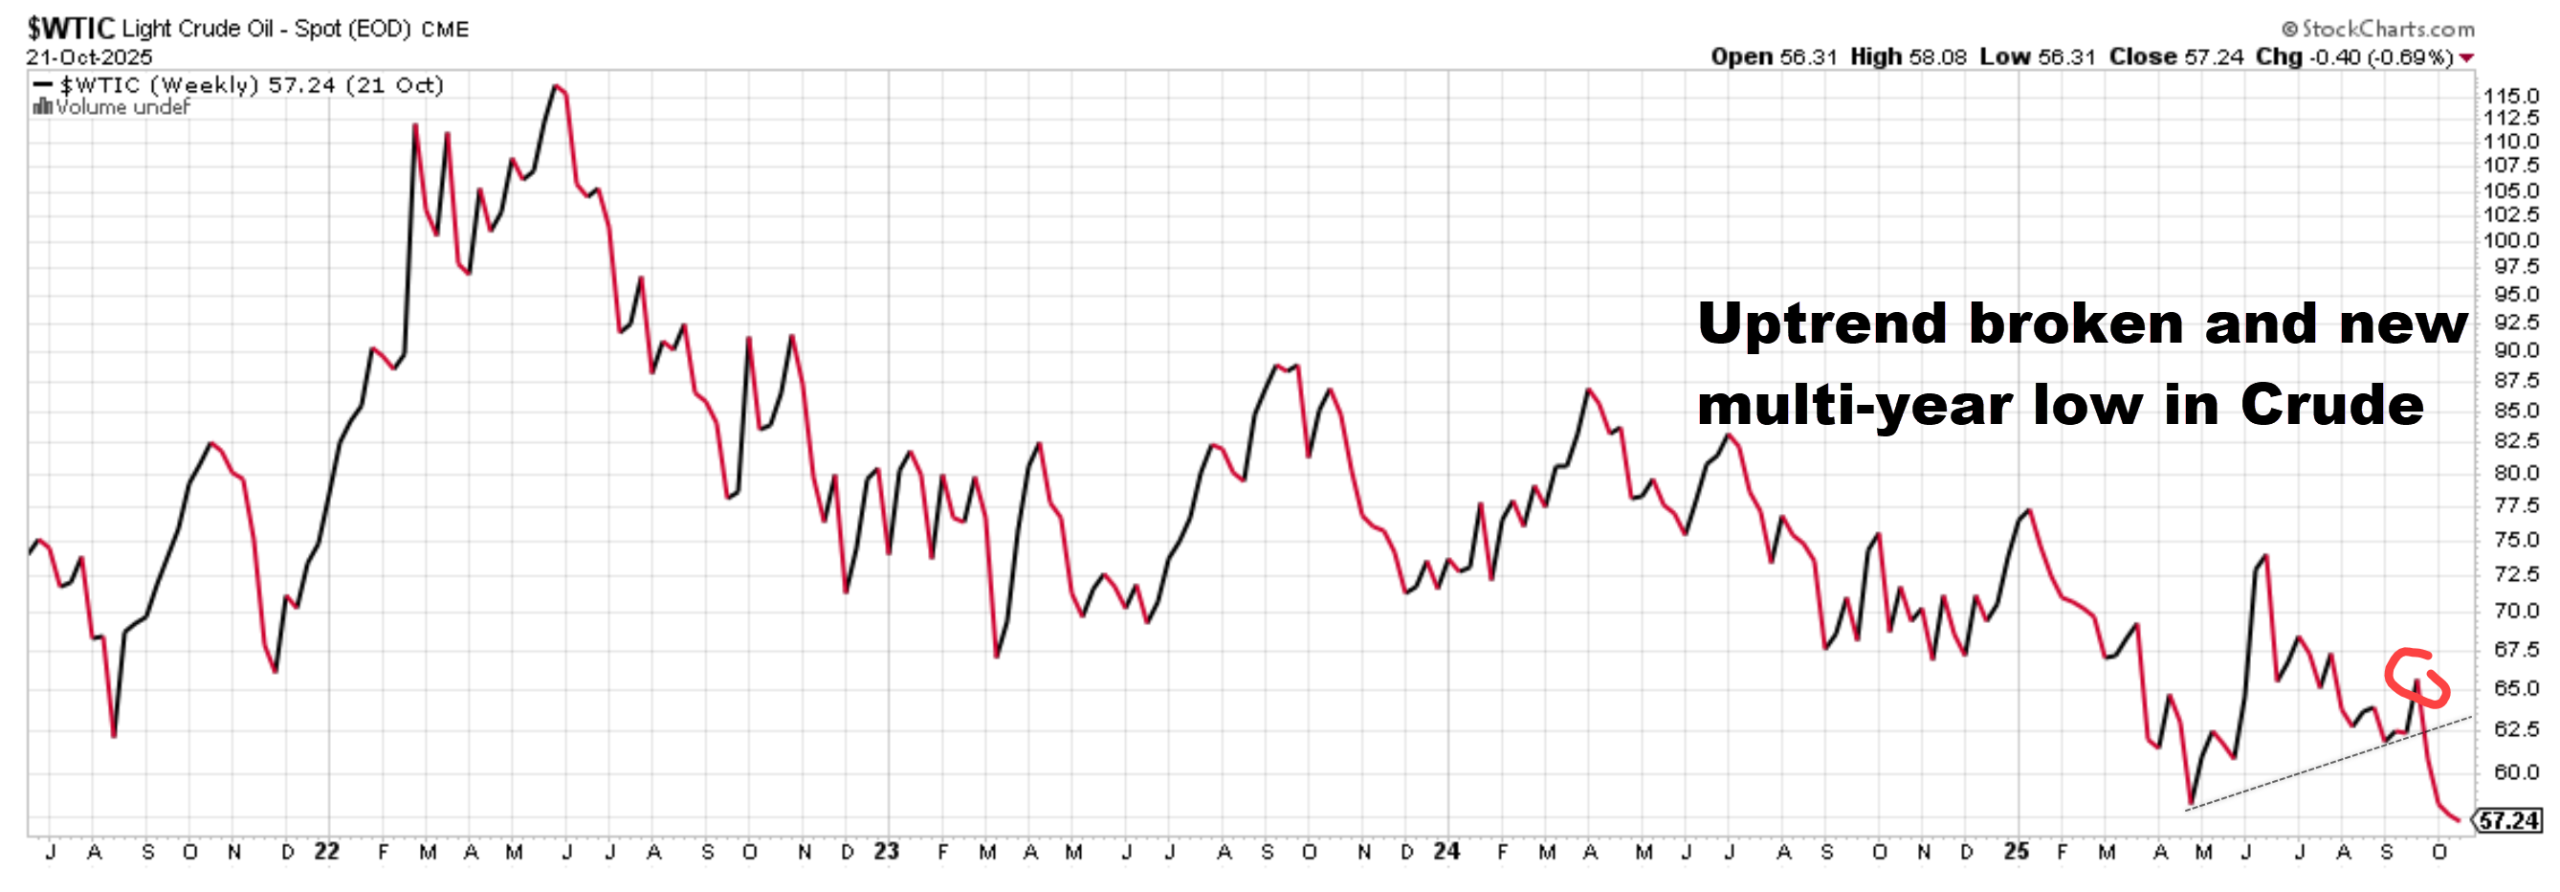
Chart courtesy of StockCharts.com
Why Oil Prices Fell in October
Three headlines hit together.
- Reports of a record amount of oil “at sea” made it look like supply overwhelmed demand.
- A few weekly data points showed inventories building.
- Some 2026 forecasts called for a surplus if supply keeps growing and demand slows.
That is enough to knock prices down in the short run.
What The Headlines Missed
China is filling storage. A meaningful slice of the “oil at sea” is on its way into new storage tanks that China is building currently. That is buying for the future, not wasted supply.
Producers can and do adjust. When prices drop too far for too long, producers pull back. The Organization of the Petroleum Exporting Countries (OPEC) and company boards have shown they will slow or pause growth to protect price.
As we mentioned at our client event, new power demand is real. Data centers are being built across North America. Much of the extra electricity load is met by natural gas. That supports the broader energy complex over time.
Why Dividends Still Look Strong
We focus on Canadian companies with strong balance sheets, low costs, and steady cash generation. At today’s prices, dividend coverage remains comfortable for most of our holdings. Current portfolio yields are roughly 4% to 6%. Could a deep and lengthy slump force changes? Yes. But low prices also remove supply, which helps prices recover. While that process plays out, we keep collecting income.
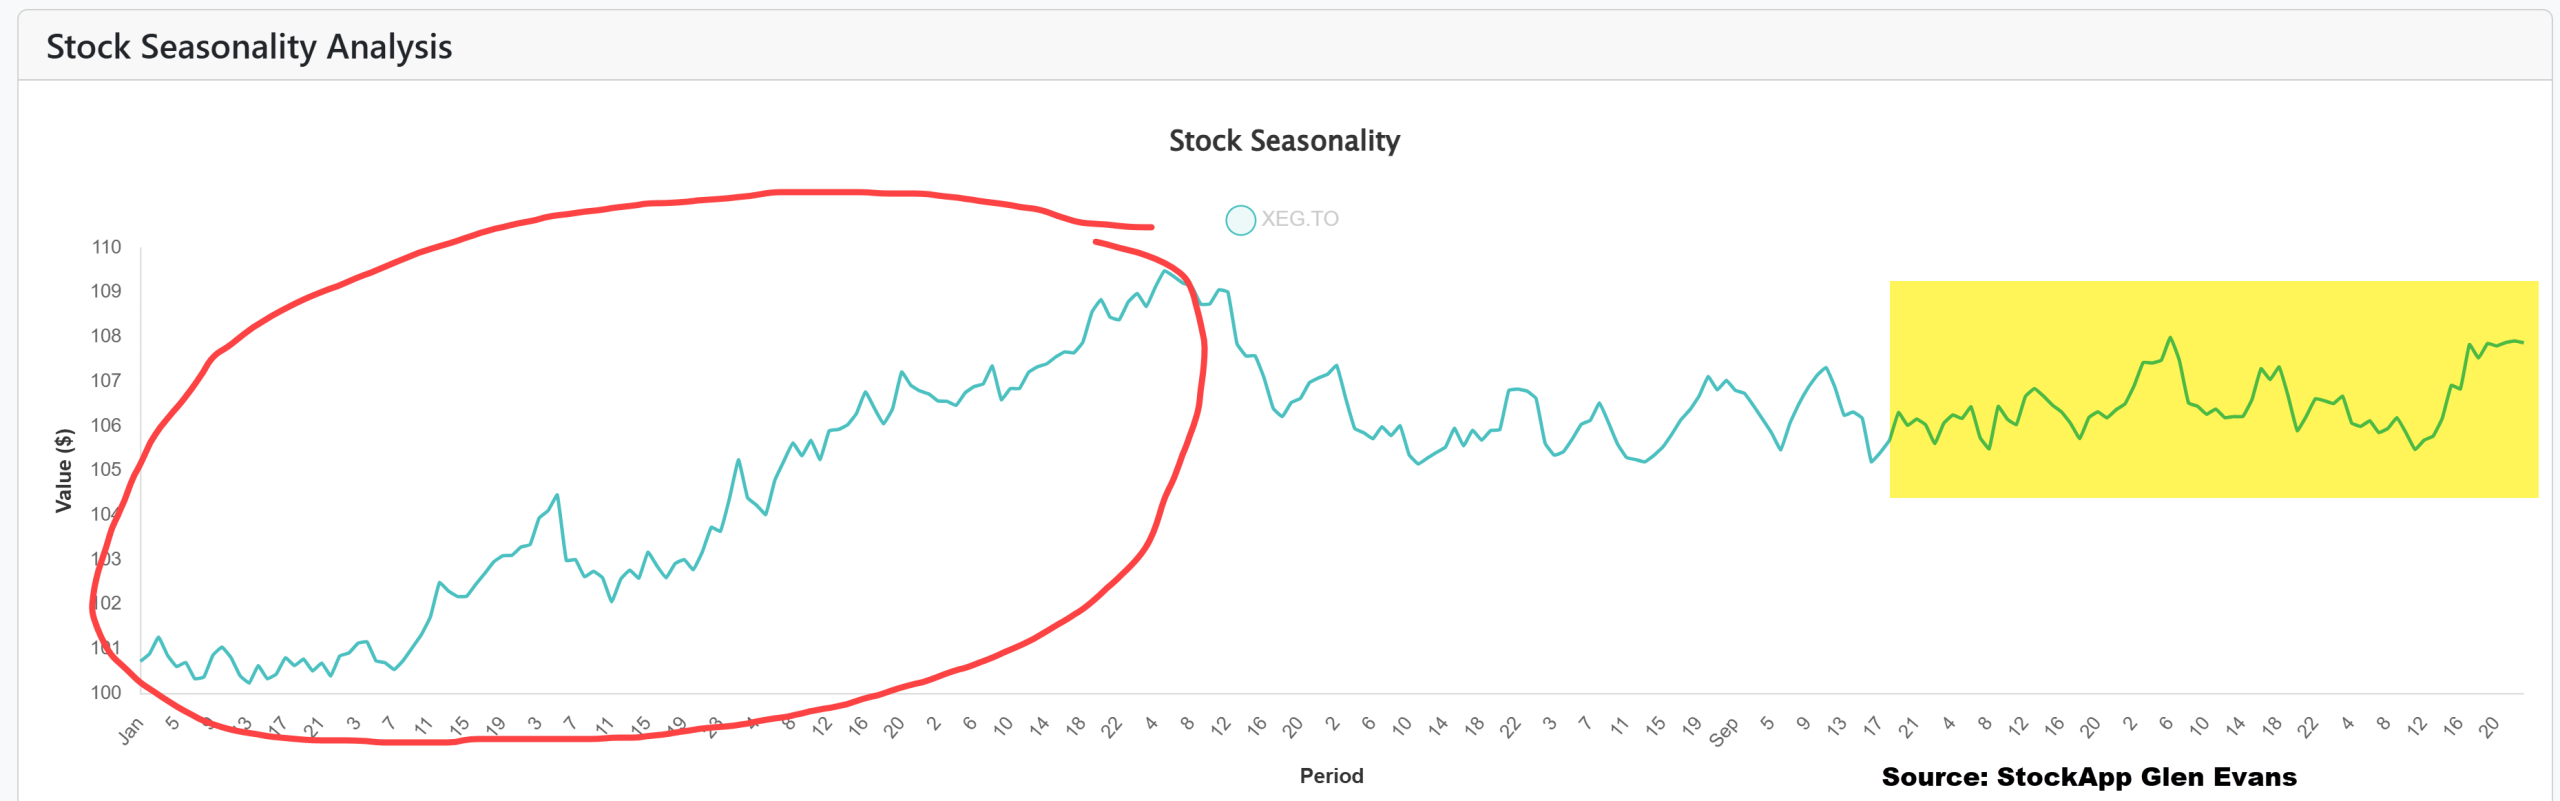
Seasonality and the Setup for 2026
The chart below shows the seasonality of the Canadian Oil and Gas Sector. This chart averages the daily performance of the sector over the past 25 years. You can see that the majority of the returns have occurred during the first quarter of the year (red circle). The optimal time to add to the sector is during the yellow highlighted time, when energy often finds support into late fall and early winter.
The Opportunity in Canadian Energy
Let’s be clear, oil is trading at a three year low in price, that’s pushed yields higher for the companies we own. Buying into weakness secures higher cash yields while we wait. Remember, the Canadian energy companies are among the highest quality names on the planet. Seasonality suggests the timing is right.
If and when oil moves back toward 70 to 75 dollars next year, cash flow and sentiment can improve quickly. That could lift prices on top of the income we receive.
Energy’s Role in a Diversified Portfolio
We don’t own energy to guess next week’s data point. We own it because real-asset cash flows behave differently than most stocks and bonds. They provide a strong hedge against inflation. In tough markets, that difference can help steady total returns. A measured allocation also brings useful income.
Bottom Line: Getting Paid to Wait
Prices fell. Cash flows did not. We’re being paid to wait for prices to recover and seasonality suggests that may happen soon. We will continue to focus on quality companies that can pay us while the market argues with itself.
Our family, serving your family.
Glen and Briana