The view from the top of the World – Midjourney
Heartbreak at 28,700 feet! A team of two climbers came within 330 feet of the peak of the south summit of Mount Everest on May 26, 1953. Realizing their oxygen was running out, the exhausted team had to return to base camp. Their heartbreak spelled hope for another team of climbers. Three days later, Edmund Hillary and his Sherpa Tenzing Norgay set out for the top. At 9:00 am they reached the south summit – but the true summit was still to come. You see the south summit was a false summit. A slight dip before an icy and rocky final spur took the men almost three hours to climb. At 11:30 am on May 29, 1953, the pair reached the highest point on earth and engraved their names in history. https://www.nationalgeographic.com/adventure/article/sir-edmund-hillary-tenzing-norgay-1953
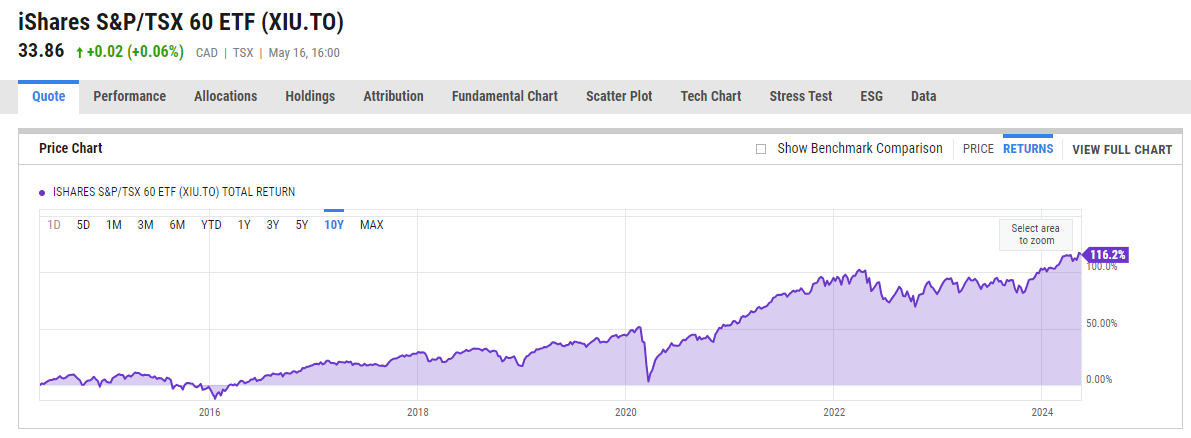
You and I are a bit like mountain climbers – the “armchair kind”! Investors sometimes call the long-term charts of stock markets “mountain charts”. You can kind of see why when you look at them yourself. I’ve included the charts of the S&P 500 and the S&P/TSX 60 below. Do you see what I see? We’re at the summit. The TSX-60 and the S&P 500 are making new all-time highs!

Source: YCharts.com

Source: YCharts.com
Isn’t that amazing? You might be wondering how this makes sense? Like a cold wind blowing up the slope, creating whiteout conditions, the media’s unrelenting negativity can make us believe recession and economic doom is imminent. How should we think about this mismatch between the performance of the economy and the stock market?
Simply put, the economy is not the stock market. The stock market looks beyond current conditions to price in future expectations. Take another look at the charts above – notice the sharp drop in 2022? That was the stock market pricing in the current economic weakness and distress we see. In the past six months, the stock market appears to be anticipating the eventual recovery of the economy as interest rates eventually are cut.
Could the stock market be overly optimistic? Of course. Will you and I have to navigate another descent at some point on our journey together? Obviously! Plenty of market participants are skeptical of the new all-time highs. They are cautioning that the market may be ahead of itself and point to the worries of the US Presidential Election, a slowing economy and persistent inflation.
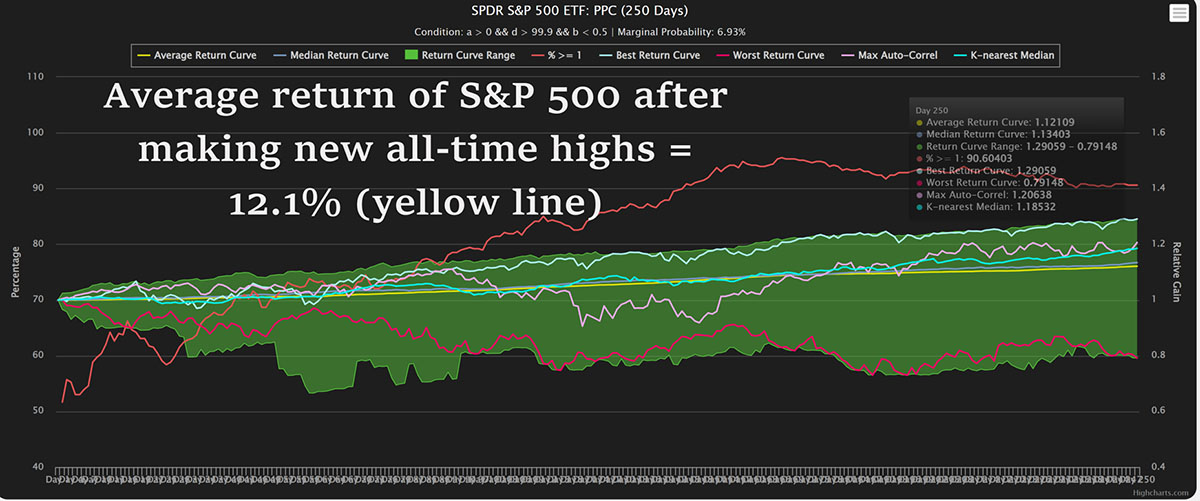
As climbers, we investors always need to be prepared for setbacks. However, new all-time highs are generally a bullish rather than bearish indicator. I ran a study that examined the average one-year performance of the S&P 500 after it made a new four-year high the average 12 month return following new highs was over 12%! While the range of outcomes was quite wide (due to the 2008 Financial Crisis) the clear takeaway for me was that new all-time highs are reason to cheer!

Source: StockApp/Glen Evans
As armchair mountaineers, we investors should occasionally stop and take in the view! Especially when the view is this good! We should congratulate ourselves for continuing to climb even when we were descending – it’s all part of the journey.


