Dear Friends and Clients,
Last month, Michael had the chance to travel to Hong Kong and Shenzhen for a friend’s wedding. The sheer scale of the infrastructure over there is staggering as is the technology and rate of change. Seeing that level of development was a stark contrast to the quiet dirt roads we grew up on in Prince Edward Island, but it reinforced a simple truth: the world is moving fast, and innovation is happening everywhere. Our job is to make sure your portfolios are positioned to benefit from it.
Before we get into the markets, we have a couple of quick housekeeping items:
Performance Update
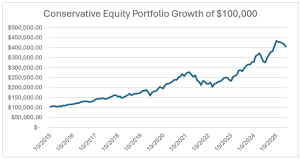
We’ve had a solid run over the past year. Our Conservative Equity portfolio is up over 22% on a one-year basis, and our Focus Total Return strategy is up 32%. We measure these returns against our benchmarks and comparable Morningstar categories, and we’re very pleased with the steady value we’ve been able to add.
While our portfolios are negative year to date and the S&P 500 is down about -4.3%, we have been pleased with the relative underlying strength of markets given all that has happened over the last couple of months.
|
Investment Performance (%) |
|
|
|
|
|
|
As of March 31, 2026 |
YTD |
1Y |
3Y |
5Y |
SI |
|
CONSERVATIVE EQUITY TOTAL GROSS RETURN (CAD) |
-5.4% |
22.3% |
21.0% |
11.8% |
14.3% |
|
Benchmark (50% DJ US Div 100; 45% S&P/TSX 60, 5% S&P Can T-Bill) |
7.8% |
21.0% |
15.3% |
11.1% |
12.0% |
|
Morningstar Category (Global Neutral Equity) |
3.2% |
12.9% |
16.0% |
9.6% |
10.3% |
|
|
|
|
|
|
|
|
DIVERSIFIED INCOME TOTAL GROSS RETURN (CAD) |
-2.5% |
13.4% |
12.7% |
8.8% |
10.4% |
|
Benchmark (35% S&P Can Bond; 25% S&P Can Div; 25% DJ US Div 100; 10% MSCI EAFE, 5% S&P Can T-Bill) |
4.9% |
14.0% |
11.0% |
7.7% |
N/A |
|
Morningstar Category (Global Neutral Balanced) |
3.5% |
10.5% |
11.3% |
6.7% |
N/A |
|
|
|
|
|
|
|
|
FOCUSED TOTAL RETURN TOTAL GROSS RETURN (CAD) |
-3.3% |
32.4% |
25.5% |
16.0% |
21.1% |
|
Benchmark (40% DJ US Div 100; 35% S&P/TSX 60, 20% S&P Can Bond, 5% S&P Can T-Bill) |
6.3% |
16.7% |
12.8% |
9.0% |
N/A |
|
Morningstar Category (Tactical Balanced) |
4.4% |
11.9% |
10.2% |
6.1% |
N/A |
*Your own returns will vary depending on the amount of fixed income you hold, cash flows in and out, and management fees.
|
LARGEST MUTUAL FUND IN CANADA (1.94% MER FEE) |
YTD |
1Y |
3 yr |
5 yr |
10 yr |
|
RBC SELECT BALANCED PORTFOLIO FUND (A) NET RETURN (CAD) |
0.1% |
11.6% |
10.5% |
6.0% |
6.5% |
Portfolio Changes
We don’t trade often. We prefer to find wonderful businesses and hold them. But when Mr. Market offers us a gift, we take it. Recently, we trimmed a little bit of our Berkshire Hathaway position—about 1%—to increase our stake in Micron Technologies.
We added to Micron at around US $358 a share. With Micron, most analysts anticipate they will earn close to US $100 a share next year. In simple terms, we are buying a business where we expect to get nearly a third of our purchase price back in earnings in just one year. That is a price-to-earnings ratio below 4. It’s a textbook value investment, and we are happy to own it.
Insights from our Chief Market Strategist
To help us make sense of the broader economic picture, we recently had Dr. James Thorne join our monthly update call. Jim holds a PhD in economics from York University, and had worked previously at several major U.S. banks and investment firms. Jim is brilliant, and he looks at the world through a deeply historical lens. His insights can sometimes be complex, so I want to boil down his main points into plain English:
Our strategy remains unchanged. We will keep ignoring the daily noise and stay focused on buying excellent companies at sensible prices, protecting your capital, and letting the power of compounding do the heavy lifting over time.
With spring around the corner we look forward to sunnier days ahead, potentially in markets as well.
Thank you for your continued trust.
Warm regards,
Michael & Simon Hale