As the “Magnificent 7” stocks — Apple, Amazon, Alphabet, Meta, Microsoft, Nvidia and Tesla — surged to start 2024, there has been much discussion about their growing concentration in the U.S. equity markets. By the start of February, their combined market capitalization represented one-third of the S&P 500 Index, with a value that would make it the second-largest country stock exchange in the world.1 As such, this has prompted some to question: Is it normal to have so few stocks dominate the markets?
However, a closer look at the S&P 500 Index suggests that over time this type of concentration has been more the norm rather than the exception. In the 1950s and 1960s, the top 10 stocks regularly made up about one-third of total market capitalization. This jumped to more than 40 percent in the 1970s, the period of the “Nifty Fifty” stocks. Though the concentration of the market capitalization of the top 10 stocks would fall below 20 percent in the 1980s, it rose again to almost 30 percent of the index’s total market cap by the end of the dot-com bubble in the early 2000s.2
In fact, this concentration is not just limited to the U.S. markets. When looking at the top 10 holdings for the G7 country stock exchanges, most countries are far more concentrated than the U.S. (graph below). Consider that Canada’s top 10 holdings make up around 43 percent of the total index, by one measurement that uses MSCI country stock market ETFs as a proxy.3
G7 Countries: Top 10 Holdings as % of Total Stock Market Cap Based on MSCI Country Stock Market ETF Data
Note: This is based on MSCI country stock market ETFs as proxies: EWC, EWQ, EWG, EWI,
EWJ, EWU, SPY. Source: https://awealthofcommonsense.com/2024/02/is-the-u-s-stockmarket-
too-concentrated/
Despite the notable surge in the big U.S. tech stocks’ performance, as investors, we should be reminded that these behemoth stocks are not impervious to downturns. Consider that during the 2022 bear market, the declines experienced by many of these stocks were significantly steeper in comparison to the S&P 500 Index: Nvidia (-66%), Facebook (-77%), Apple (-31%), Google (-45%) and Amazon (-56%), compared to the 25 percent decline of the S&P 500 Index.2
Diversification Quilt: Sub-Asset Classes, 2014 to 2023
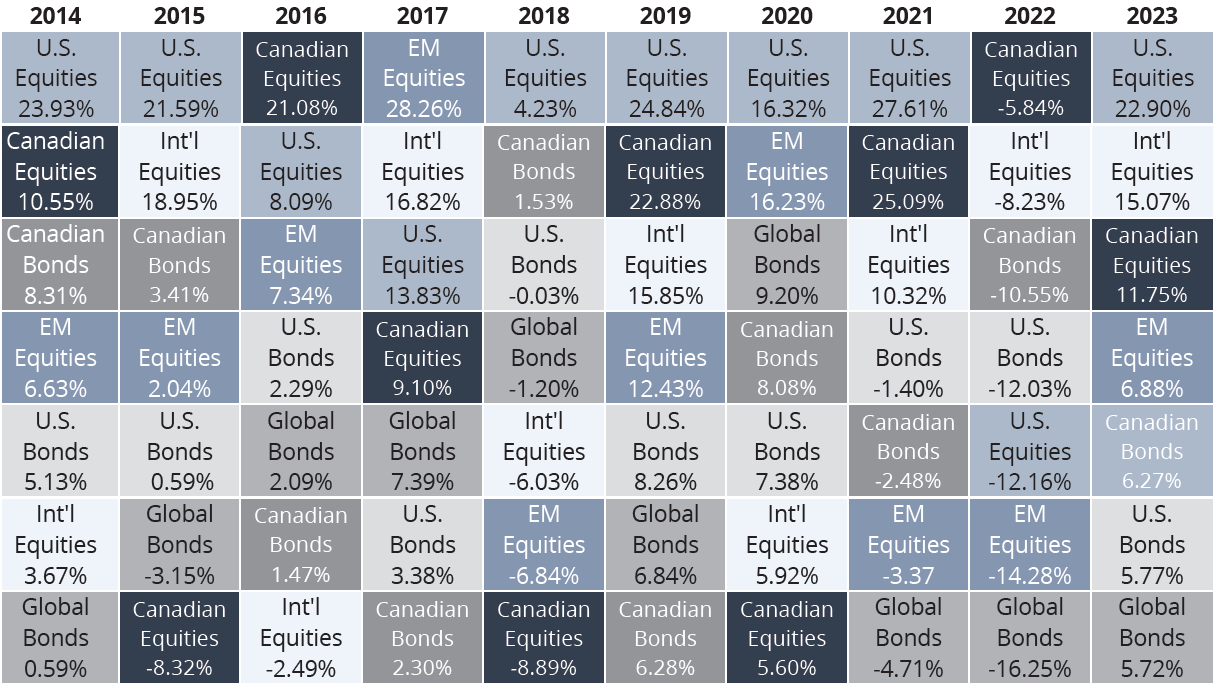
Past performance isn’t indicative of future performance. Emerging g Markets Equities: MSCI EM (CAD) ; Canadian Equities:
S&P/TSX Composite TR; US Equities: S&P 500 TR (CAD); International Equities: MSCIEAFE (CAD); Canadian Bonds: S&P Canada
Aggregate Bond Index; Global Bonds: Bloomberg Global
This is just one reason to highlight the importance of diversification. Different sectors, geographies and asset classes can exhibit varied performance at different times. As the chart above shows, no single sub-asset class has consistently performed at the top over time. Diversification serves to shield against the downturns that can affect sectors at different times, while giving access to the top performers.
Also worth noting: While the tech sector advances have dominated recent headlines, the sector hasn’t always led the S&P 500 Index over recent years. In 2021 and 2022, the energy sector was the leader. Over the past decade, healthcare and consumer discretionary sectors have sometimes taken the lead. To view the sector allocation quilt of the S&P 500, please see: https://awealthofcommonsense.com/2024/01/equal-weight-investing/. Indeed, sectors, geographies and even asset classes will come in and out of favour over time.
The ever-evolving landscape is just one reason why we continue to stress the importance of diversification in thoughtful portfolio management. If you have questions about this, or any other portfolio management matters, please contact the office.
1. Market capitalization is the share price times the number of shares outstanding. https://www.cnbc.com/2024/02/19/magnificent-7-profits-now-exceed-almost-everycountry–2. https://awealthofcommonsense. com/2024/02/is-the-u-s-stock-market-too-concentrated/;3. Using MSCI country stock market ETFs as the means of measurement.
The information contained herein has been provided for information purposes only. Graphs, charts and other numbers are used for illustrative purposes only and do not reflect future values or future performance of any investment. The information has been provided by J. Hirasawa & Associates and is drawn from sources believed to be reliable. The information does not provide financial, legal, tax or investment advice. Particular investment, tax, or trading strategies should be evaluated relative to each individual’s objectives and risk tolerance. This does not constitute a recommendation or solicitation to buy or sell securities of any kind. Market conditions may change which may impact the information contained in this document. Wellington-Altus Private Wealth Inc. (WAPW) and the authors do not guarantee the accuracy or completeness of the information contained herein, nor does WAPW, nor the authors, assume any liability for any loss that may result from the reliance by any person upon any such information or opinions. Before acting on any of the above, please contact me for individual financial advice based on your personal circumstances. WAPW is a member of the Canadian Investor Protection Fund and the Investment Industry Regulatory Organization of Canada.
Insurance products are provided through Wellington-Altus Insurance Inc.
© 2024, Wellington-Altus Private Wealth Inc. ALL RIGHTS RESERVED. NO USE OR REPRODUCTION WITHOUT PERMISSION.
www.wellington-altus.ca
If you no longer wish to receive commercial electronic messages from Wellington-Altus Private Wealth Inc., please send an email to unsubscribe@wellington-altus.ca