
The Price of Resilience
The cost of capital is changing how investors evaluate opportunities, manage risk and plan for the future.
Higher long-term bond yields are creating new income opportunities but also increasing financing costs. Governments and businesses are investing in more secure supply chains and infrastructure, even as those investments demand greater financial discipline. Meanwhile, the growth of private markets and the complexity of wealth transfers are raising important questions about access to capital and continuity.
These seemingly unrelated developments share an important characteristic: decisions made in one area can have consequences elsewhere. In this issue, we examine these connections and the practical considerations they raise for investors.
In this issue:
What “Higher For Longer” Means For Your Bond Portfolio
The New Economics of Resilience
When Wealth Is Diversified But Not Liquid
The Succession Planning Gap
Year End Tax Planning After the Policy Dust Settles
Beyond the AI Trade: Where is the Next Wave of Capital Going?
THE LONG END OF THE YIELD CURVE
What “Higher For Longer” Means For Your Bond Portfolio
Higher long-term yields are changing the trade-offs between income, price sensitivity and the obligations a portfolio must support.
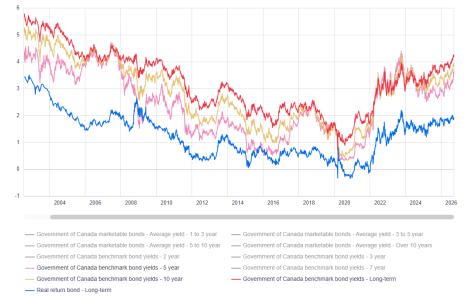
Bond investors are facing an unusual combination of opportunity and pressure. Long-term government yields in Canada and the United States have risen to levels not seen for many years. On September 25, 2026, the U.S. Treasury curve closed at 4.98% for five years, 5.17% for 10 years and 5.49% for 30 years.¹ Canadian benchmark yields for the same time period were 3.69% for five years, 3.97% for 10 years and 4.27% for the long-term benchmark.² (see Chart)
High yields can improve the income available from high-quality fixed income. They also raise financing costs and place pressure on assets whose valuations depend on inexpensive capital. The same market movement can therefore help one part of an investor’s balance sheet while creating strain elsewhere.
Exhibit: Average Yields For Selected Government Of Canada Marketable Bonds: 2004 – 2026
Source: CanDeal Data and Analytics (CanDeal DNA) and Bank of Canada
https://www.bankofcanada.ca/rates/interest-rates/canadian-bonds/
Why Long Rates Move Differently
Central banks set very short-term policy rates. Investors determine longer-term bond yields through the prices they are willing to pay for securities that mature years or decades in the future. The latter reflect expected inflation and economic growth, as well as compensation for committing capital over a longer period.
At the same time, there is a volume story happening. Large fiscal deficits and heavy government issuance require investors to absorb more supply. Corporate borrowers compete for the same capital, adding to the financing demands placed on the market.
This helps explain why long-term yields can remain elevated even when the path for an overnight policy rate is less clear. It also means that a forecast about the next central bank decision is not enough to guide a long-term bond allocation.
The Effect Beyond Bonds
When yields rise, the price of an existing fixed–rate bond generally falls because newly issued securities offer more attractive income. The effect is greater for longer-maturity bonds, which have more payments exposed to a change in market rates.
Higher yields also change the economics of borrowing. Mortgages, investment loans, business credit and commercial real estate financing may become more expensive to renew. Companies facing higher funding costs might delay projects or demand a higher expected return before investing. And assets purchased with leverage can feel the effect from both lower valuations and more costly debt.
For investors who own businesses, real estate or private investments alongside marketable securities, the relevant exposure can be larger than the bond allocation suggests. A portfolio review should look at where rising rates affect income, valuations and liabilities at the same time.
The Role of Fixed Income In Your Portfolio
Capital reserved for a near-term obligation requires a different approach from assets intended to generate income over decades or provide balance during equity-market declines. So, begin by determining what fixed income is intended to accomplish in your portfolio.
Shorter maturities can limit price volatility and provide access to capital, exposing investors to reinvestment risk. If yields decline, maturing securities may have to be reinvested at lower rates. Longer maturities can secure income over an extended period and benefit from lower yields, although their prices are more sensitive to changes in interest rates.
To balance these trade-offs, create a diversified maturity structure where the appropriate allocation reflects expected cash requirements, credit quality and the sensitivity of the rest of the portfolio to interest rates. In addition, take into account the timing of debt renewals and other obligations outside the investment account.
A useful analysis can map maturities against known cash needs and test what happens if yields move another 50 or 100 basis points in either direction. This helps you understand where the portfolio would gain, where it would lose, and whether sufficient capital would remain available when needed.
As you review your fixed income portfolio, work with your advisor to understand whether the income, maturity and risk characteristics are aligned with the obligations that capital is intended to support. Higher yields create opportunities to improve that alignment, provided investors consider the other side of their balance sheet.
Sources
1. U.S. Department of the Treasury, Daily Treasury Par Yield Curve Rates. Accessed September 25, 2026
2. Bank of Canada, Selected Bond Yields. Accessed September 25, 2026
SECURITY AND REDUNDANCY ARE REDIRECTING CAPITAL
The New Economics of Resilience
Security, redundancy and domestic capacity are changing where capital is deployed, but greater spending does not guarantee stronger investment returns.
For much of the past three decades, businesses pursued a straightforward objective: produce more efficiently, source from the lowest-cost suppliers, and minimize excess capacity. In tandem with this objective, global supply chains became increasingly specialized. With just-in-time inventory systems reducing costs, companies concentrated production in locations offering the greatest economies of scale.
That model delivered substantial benefits; it also created dependencies that have become harder to ignore during sustained periods of geopolitical tensions, trade restrictions and energy disruptions.
Now, governments and businesses are responding by placing greater value on economic security, even when achieving it requires higher upfront investment. For investors, this changes both where capital may flow and how potential beneficiaries should be evaluated.
Efficiency Is No Longer Enough
The International Energy Agency’s Global Critical Minerals Outlook 2026 projects strong growth in demand for minerals used in energy technologies. The same outlook highlights the geographic concentration of mining and refining, which can leave industries exposed to a disruption in one major processing location.¹
The challenge extends beyond extracting raw materials to processing facilities, specialized equipment, technical expertise and manufacturing capacity. Building alternative supply chains requires investment across the production process, often with substantial capital requirements and long development timelines.
A company may accept higher procurement costs, hold additional inventory or maintain a second supplier in exchange for more reliable access to essential inputs. The relevant question is whether the reduction in potential disruption justifies the added cost.
Investment Priorities Are Changing
This shift is influencing capital spending across electricity grids, transportation infrastructure, industrial automation, cybersecurity, critical minerals and domestic manufacturing.
The 2024 Draghi report on European competitiveness estimated that the European Union would need hundreds of billions of euros in additional annual investment to support its energy, digital, defence and security priorities.² Canada is pursuing similar objectives through its Critical Minerals Strategy, which emphasizes domestic production, processing, manufacturing and recycling, as well as supply relationships with international partners.³
Investment in these areas can serve several purposes:
These needs create durable pools of demand, but they don’t make every company serving them an attractive investment.
A Growing Market Does Not Guarantee Attractive Returns
For example, a government commitment to expand domestic mineral processing can create demand for new facilities and equipment. Yet, projects still require substantial upfront investment, face lengthy permitting processes, and encounter cost overruns before generating revenue.
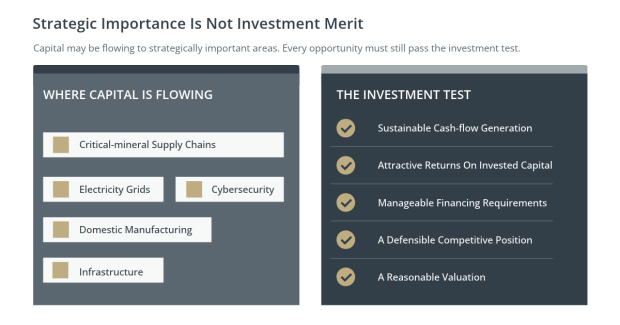
Even when demand materializes, profitability depends on the competitive environment. An industry experiencing rapid investment might eventually develop excess capacity, putting pressure on prices and returns. While government support in the form of subsidies, procurement commitments and other incentives can improve project economics, changes in policy or funding also affect their value.
For investors, the relevant distinction is between exposure to an attractive theme and ownership of an attractive business. Sustainable cash flow, returns on invested capital, financing requirements and valuation remain essential measures. Strategic importance may support demand, but it does not eliminate commercial risk.
The Implications For Investors
Reassess your exposure to supply chain disruption, look for overlap across holdings, and evaluate which investments have the potential to convert structural demand into attractive returns on capital. Several investments in industrials, energy, infrastructure and materials may appear diversified, but they still depend on the same government programs, commodity cycles or financing conditions. Understanding those common drivers helps separate genuine diversification from repeated exposure to one economic thesis.
The shift toward security and redundancy is changing investment priorities, not suspending the fundamentals of investing. The enduring opportunity lies with businesses that can convert greater demand for reliability into sustainable cash flow and attractive returns on capital.
Sources
1. International Energy Agency, Global Critical Minerals Outlook 2026.
2. European Commission, The Draghi Report on European Competitiveness.
3. Government of Canada, The Canadian Critical Minerals Strategy.
PRIVATE MARKETS AND THE TIMING OF CAPITAL
When Wealth Is Diversified But Not Liquid
A portfolio can contain many assets and still leave an investor without sufficient capital at the moment it is needed.
There are four common cases in private markets where the issue is a mismatch between when capital is needed and when it becomes available: an investor holds millions of dollars in assets and still faces an unexpected funding problem; an acquisition requires cash before a private equity distribution arrives; a significant tax payment coincides with a real estate refinancing; or an attractive investment opportunity arises when much of the portfolio is committed to assets that cannot readily be sold.
As private market investments become a more significant part of sophisticated portfolios, the distinction between diversified holdings and liquidity ones becomes important.
Differentiating Diversification From Liquidity
Diversification describes how capital is spread among investments and economic exposures. Net worth measures the value of assets after liabilities. Liquidity concerns the amount of capital that can be accessed within a given period and on acceptable terms.
For example, an investment holding is diversified across private equity, private credit, real estate and an operating business. And yet, the investor still depends on a relatively small pool of marketable securities for near-term spending and obligations. The portfolio is broad by asset class, narrow by access to cash.
Private investments can provide access to companies, lending opportunities and return drivers that are not available in public markets. Their long holding periods also support longer term ownership. Those features are valuable precisely because the capital is committed. However, they should not be mistaken for ready liquidity.
Fund Structures For Capital Movements
The Financial Stability Board estimated that private credit represented US$1.5 trillion to US$2 trillion in assets at the end of 2024. Its 2026 review recognized the sector’s financing and diversification benefits, but also identified concerns related to leverage, borrower quality, valuation practices, data gaps and liquidity mismatches.¹
Some private funds have finite lives. Investors commit capital that is drawn over time and receive distributions as underlying assets are sold or loans are repaid. Other vehicles offer periodic redemption windows with withdrawals limited when requests exceed a fund’s repurchase capacity.
In September 2026, Morgan Stanley’s North Haven Private Income Fund received redemption requests equal to 11.4% of assets against a quarterly repurchase limit of 5%.² That experience does not describe every private fund, but it shows why a stated redemption feature is not the same as an assurance that all requested capital will be returned on a particular date.
The Cost Of Accessing Liquidity
There are several scenarios to consider when planning to access liquidity:
The right question is not simply how much liquidity is available. It’s how much can be accessed, when and on what terms. Consider this illustrative scenario (see Exhibit):
Exhibit: Illustrative Portfolio Value vs. Accessible Capital
|
Asset |
Value |
|
Private Equity |
$4.0M |
|
Private Credit |
$2.0M |
|
Real Estate |
$2.0M |
|
Public Securities |
$2.0M |
|
Total Portfolio Value |
$10.0M |
Near-Term Liquidity Position
|
Item |
Value |
|
Potentially Accessible Capital |
$2.0M |
|
Known Near-Term Funding Requirement |
$1.0M |
|
Capital Remaining Before Other Obligations |
$1.0M |
The remaining amount must also support potential capital calls, taxes, spending and unexpected needs. High net worth does not automatically equal liquid wealth.
Map Obligations And Funding Across Time
A liquidity plan can organize assets, obligations and available funding into three practical periods:
Format: Two-column table
|
Time Horizon |
Planning Focus |
|
Next 12 months |
Operating cash, taxes, near-term commitments and a margin for unexpected needs |
|
1 to 3 years |
Debt maturities, capital calls, major purchases and expected distributions |
|
More than 3 years |
Long-term investments and capital that can tolerate uncertain exit timing |
The purpose of this exercise is to compare obligations with realistic access to capital in each period. The analysis can include expected fund distributions, capital calls, credit facilities, business cash flows and other funding sources; then, test what happens if exits are delayed or several demands arrive at once.
Wealth measures what an investor owns; liquidity determines how much freedom that wealth provides. As such, the latter should be evaluated before it becomes necessary. A portfolio that accounts for the timing of commitments, distributions and available funding can allow long-term investments to remain invested through periods when selling would be costly or impractical.
Sources
1. Financial Stability Board, Report on Vulnerabilities in Private Credit
2. Reuters, Morgan Stanley Private Credit Fund Redemption Requests Remain Elevated
THE GREAT WEALTH TRANSFER
The Succession Planning Gap
A transfer plan must address ownership, control and readiness, not only who receives an asset.
In Canada, the transfer of substantial wealth is already underway, yet many succession plans remain incomplete. Their reasons are often understandable and include wanting to preserve flexibility, remaining uncertain about how to divide assets, or a successor who is not ready.
Delay has a cost as fewer options remain after an illness, conflict, death or unsolicited offer forces decisions onto a compressed timeline.
According to the UBS Global Family Office report, 57% of surveyed family offices had wealth succession plans for family members. At the same time, there’s a disconnect between intent and execution as only 13% of next-generation family members who are considered old enough to participate remain fully involved in family office decision-making; 21% have no involvement at all.¹
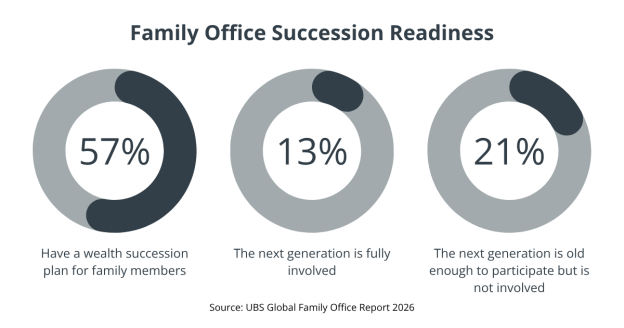
These findings point to an issue that legal documents alone cannot resolve. A technically sound estate plan may specify who receives an asset without preparing that person to own it, manage it or participate in decisions. The people affected by a plan need enough information and time to understand the responsibilities it creates.
Transferring Ownership And Control
Succession becomes more complicated when transferring an asset also means shifting responsibility for its management. Professional executives assume responsibility for daily operations even as ownership remains within the family. A sale to management, employees or a third party can further separate the continuity of the enterprise from family ownership.
These arrangements require clarity about decision rights:
The answers may involve shareholder agreements, governance structures and coordinated legal, tax and financial advice. Without that clarity, a completed ownership transfer can leave unresolved questions about how the business or other assets will be managed.
A Wider Set Of Succession Paths
Succession does not always mean a parent-to-child transfer. Business owners may prefer a management buyout, an employee-ownership structure or a third-party sale. Individuals without children or intended family successors may be planning transfers to spouses, relatives, trusts or charitable organizations.
Canada has also expanded the menu for qualifying business owners through the Employee Ownership Trust framework and its related capital-gains exemption.² This can be relevant when an owner wants employees to acquire the business; however, it doesn’t remove the need for valuation, financing, governance and specialist tax advice.
Each path produces different implications for control, liquidity, taxation and the future of the underlying asset. The preferred option should be tested against the owner’s objectives and the practical readiness of those expected to take responsibility.
Build The Plan In Stages
A practical starting sequence is to clarify objectives, map current ownership and decision rights, assess successor readiness and estimate the liquidity that a transition may require. The next step is to compare plausible transition paths and identify where legal documents, governance arrangements, insurance or financing must change.
This staged approach does not require every future decision to be fixed today. It creates a framework that can evolve as circumstances change; ensuring that critical information, authority and funding do not depend on one person being available.
The investment advisor’s role is one part of that process. Estate counsel, tax professionals, valuation specialists and corporate advisors may each address different technical issues. Financial advice can help connect their recommendations to portfolio liquidity, investment risk and the owner’s wider objectives.
Succession planning is about more than determining who receives an asset. It establishes who will make decisions, how responsibilities will transfer, and whether the people and financial resources needed to support that transition are in place. A plan can evolve as circumstances change. Its value lies in ensuring that essential decisions are made deliberately rather than under the pressure of an unexpected transition.
Sources
1. UBS, Global Family Office Report 2026
2. Department of Finance Canada, press release
TAX DECISIONS RARELY STAND ALONE
Year End Tax Planning After the Policy Dust Settles
The value of year-end planning lies in modelling how transactions interact, then coordinating the order and timing of execution.
Let’s start with a hypothetical scenario where an investor has a concentrated equity position with substantial unrealized gains, declining value in investments that led to realization of portfolio losses, and a planned charitable donation at the same time as when the sale of shares in a privately held business is under consideration.
Each of these situations presents a decision to make regarding the potential tax-planning opportunity. And the order, timing and interaction of those transactions could produce very different outcomes.
Impact Of Policy Clarity On Decision-making
One significant source of uncertainty in recent years has been resolved. In March 2025, the federal government cancelled its proposed increase in the capital gains inclusion rate from one-half to two-thirds. The general inclusion rate therefore remained 50%.¹
The increase in the Lifetime Capital Gains Exemption for qualifying small business corporation shares and qualified farming or fishing property was retained, with indexation resuming in 2026. The amount and eligibility conditions should be confirmed against current guidance for any contemplated transaction.
These developments provide a clearer policy setting for investors and business owners. However, they do not determine the best timing of a sale, the treatment of investment losses or how a charitable contribution fits within a wider financial plan.
When One Tax Decision Changes Another
Tax-loss harvesting provides a useful example. Investors with unrealized losses in non-registered accounts may consider selling certain holdings to offset realized capital gains. Net capital losses can generally be carried back three years or forward indefinitely, subject to applicable rules.²
Selling a security at a loss and immediately repurchasing identical property may trigger the superficial-loss rule, potentially denying the immediate deduction. The rule can also apply when an affiliated person or entity acquires the identical property within the relevant period and continues to hold it 30 days after the sale.
Charitable giving introduces another interaction. Donating eligible appreciated publicly traded securities directly to a qualified donee can result in a zero capital-gains inclusion rate for regular income-tax purposes and may generate a charitable donation tax credit.³
The Alternative Minimum Tax (AMT) calculation treats the same transaction differently. Under the rules applicable in 2026, 30% of the accrued gain on donated publicly listed securities is included in adjusted taxable income; only 80% of the donation tax credit is recognized. The AMT calculation also includes 100% of other capital gains and permits only 50% of capital losses carried forward from prior years to be deducted.
These differences mean that realizing a significant gain, using carried-forward losses and making an in-kind charitable gift in the same year can produce an AMT liability even when each transaction appears tax-efficient under the regular calculation.
AMT doesn’t necessarily represent a permanent additional cost. An amount paid can generally be carried forward for seven years and applied against future regular tax when regular tax exceeds AMT. Recovery depends on the investor’s future taxable income. Scenario modelling should therefore consider both the current-year liability and the likelihood and timing of recovering any AMT paid.
Another constraint is liquidity. Even if AMT can eventually be recovered, it may create an immediate cash requirement. The investor must determine whether the remaining portfolio can support anticipated tax payments and other financial commitments after the transactions are completed. If private-company shares are involved, eligibility for the Lifetime Capital Gains Exemption and the sequencing of legal or corporate steps could also affect timing.
Comparing a base case with alternative transaction sequences can reveal which approach supports the investor’s objectives without introducing avoidable financial or tax consequences.
A Coordinated Process For The Final Quarter
Having a coordinated and staged process keeps tax efficiency in its proper place. Begin by assess the current position on projected income, realized and unrealized gains, available losses, investment holdings, expected obligations and planned transactions.
The investment advisor, accountant and legal counsel can then evaluate how each scenario affects regular income tax, AMT, portfolio exposure, liquidity and any corporate or trust arrangements. Their roles remain distinct, but the analysis should use the same assumptions and transaction sequence.
And remember, in-kind charitable donations, private company transactions, legal reorganizations and securities transfers can require documentation and processing well before December 31. So, an execution calendar should identify dependencies, professional approvals and operational deadlines, along with decisions that require further analysis or are better deferred.
Exhibit: Year-End Planning Process
|
Stage |
Focus |
|
Assess the Current Position |
Income, gains and losses, holdings, obligations and planned transactions |
|
Compare Scenarios |
Regular tax, AMT, liquidity and portfolio implications |
|
Coordinate and Execute |
Donations, transfers, legal and corporate steps, approvals and deadlines |
Year-end planning is most effective when decisions are considered together rather than as a collection of individual tax saving strategies. As you enter the new year, do so with a clearer understanding of how investment choices, tax obligations, liquidity and longer-term objectives fit together, supported by an execution plan that reflects those connections.
Sources
1. Government of Canada, press release
2. Canada Revenue Agency, Capital Losses
3. Canada Revenue Agency, Gifts and Income Tax
4. Department of Finance Canada, press release
Beyond the AI Trade: Where is the Next Wave of Capital Going?
Artificial intelligence (AI) has been around for seventy years, but its early adoption was hampered by limited computing power and insufficient investment in supporting infrastructure. Over the past twenty years, the first obstacle has eased considerably. Addressing the second has become a defining investment theme of the decade, as investors seek allocations that balance opportunity with resilience.
For much of the AI boom, the investment story centred on a relatively familiar group of technology companies, from semiconductor manufacturers and cloud providers to firms developing sophisticated AI models. But the opportunity is expanding as capital pours into the physical and financial infrastructure required to support AI at scale, including data centres and supply chains serving the broader ecosystem.
In August, NVIDIA announced that it had signed memorandums of understanding with Apollo, BlackRock, Blackstone, Brookfield, Goldman Sachs and KKR to establish independent financing platforms. Together, the proposed partnerships are intended to mobilize more than US$500 billion in third-party capital over time for the build-out of AI compute infrastructure.1 The announcement is notable not simply for its size, but for what it suggests about the evolution of AI as an investment theme.
As AI moves from experimentation toward widespread commercial deployment, it raises a broader question: How much AI exposure may already exist across a portfolio—and where does it actually sit?
Financing the AI Ecosystem
Running progressively powerful AI models requires vast computing capacity. That means more semiconductors and servers, but also data centres, electricity generation and transmission, cooling systems, networking equipment, construction and financing.
The scale of the build-out has significant implications for financing. McKinsey estimates that cumulative global spending on data centre infrastructure could approach US$7 trillion through 2030.2 The International Energy Agency (IEA), meanwhile, has noted that planned data centre investment is becoming too large to rely solely on the balance sheets of technology companies, increasing the role of capital markets and other sources of financing.3
As a result, the AI ecosystem increasingly spans asset classes. Public technology companies remain part of the story, but so do utilities and industrial businesses, infrastructure funds, private equity, private credit and other alternative investments. Together, these enablers of the AI economy signal a growing investment opportunity.
Diversified Assets With Shared Assumptions
Some institutional and family-office investors are already taking a broader approach to assessing AI-related exposure. UBS’s 2026 Global Family Office Report found that 65 percent of surveyed family offices were invested across the AI value chain. At the same time, 37 percent were allocating to power and resources and 37 percent to infrastructure—two areas closely connected to AI’s expansion.4
Taken together, these findings illustrate how AI-related exposure can extend into parts of a portfolio that may not carry an explicit AI label. As a result, a complex portfolio can appear diversified on an asset allocation statement while still being influenced by the same underlying economic theme.
Consider a portfolio that includes shares in major technology companies, an infrastructure fund with data centre exposure, private credit financing AI-related projects and utilities expanding generation capacity to meet rising electricity demand. On paper, these investments sit in four different portfolio categories. Their specific risks and return profiles are not identical, but each depends, to varying degrees, on continued growth in AI-related capital spending.
This does not negate the benefits of a diversified portfolio. It does, however, suggest that diversification by asset class is not necessarily the same as diversification by underlying economic exposure.
Assessing Value Across the AI Value Chain
When wealth also includes privately owned businesses, direct investments or significant real estate holdings, identifying total exposure is only the first step. The next is determining where within the expanding AI ecosystem durable economic value is most likely to accrue.
Rapid investment cycles can produce both winners and excess capacity. AI infrastructure may face constraints ranging from electricity availability and permitting delays to rapidly evolving technology. Assets designed around today’s requirements may need to adapt as computing becomes more efficient or new technologies emerge.
Large amounts of investment don’t guarantee attractive returns across the value chain. Likewise, investing in a large publicly traded technology company is not economically equivalent to committing capital to AI infrastructure. As the opportunity set expands, it becomes important to consider which assumptions underpin each investment and whether the expected return appropriately reflects its liquidity, duration and risk.
A Total-Wealth View of AI
AI is likely to remain an important investment theme, although its long-term impact and investment implications remain uncertain. What is changing is how investors gain exposure to it, both directly and indirectly. Reviewing that exposure across your total wealth with your advisor can help answer a more useful question: Where does your AI exposure sit, what risks connect those investments, and how do they fit together?
As the AI investment ecosystem expands, understanding those connections may matter just as much as identifying the next opportunity.
Sources