
MONTHLY MARKET UPDATE
Last month in the markets
October 1 – 30, 2026
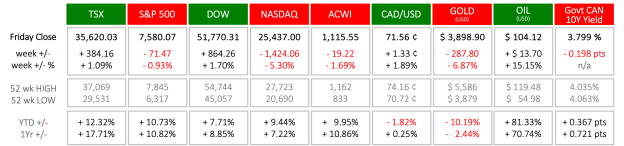
Index returns based on index value. Sources: Bloomberg, MSCI and ARG Inc. analysis. Price returns are reflected.
What Happened in October
Equity markets delivered mixed results and increasing volatility in October. Even the volatility of the Volatility Index has become more volatile in the second half of last month. The sources of unsatisfying results and volatility are not a mystery, they include, but are not limited to the following:
• The U.S. /Iran war continues. The restriction of oil shipments through the Strait of Hormuz and the Bab al-Mandab Strait at the southern end of the Red Sea has pushed the price of oil back towards its 52-week high. The price has risen more than 80% in 2026.
• Energy (crude oil, gas, diesel, etc.) is a component cost of nearly every product and service, and increased energy prices will drive the price inflation of almost everything else.
• Increasing and persistent inflation will eventually require monetary policy from central banks to temper inflation. The speculation and timing of interest rate increases influence price expectations of stocks and bonds.
• Restrictive trade practices (i.e. tariffs) initiated by the U.S. president have also contributed to domestic and import/export inflation around the world.
• Political uncertainty in the U.S. as the midterm elections could have the balance of power shift from the Republicans to the Democrats in the House of Representatives and the Senate. Until, and even perhaps after, the election is decided will the legislative waters calm.
What’s Ahead for November and Beyond
The return to stability would be welcomed by all but the most adventurous investors. Geopolitical conflict must subside to allow energy prices to fall, then inflation can no longer be pushed along, international diplomacy must manifest itself through trade treaties and the legislatures and governmental bodies in the U.S. must perform more consistently to promote a return to predictability and performance.
The Bank of Canada and U.S. Federal Reserve will announce interest rate decisions on December 9. The currently predicted U.S. rate increase (75% likelihood according to CME’s FedWatch tool) would begin to slow the economy and the growth of inflation if it occurs. After the recent Bank of Canada increase, it is less likely that the next announcement would bring a rate hike.
The results of the elections could influence markets but typically do not deliver the dire consequences that unsuccessful candidates suggest. Read CNBC’s analysis of midterm election effects on markets to see that markets often perform well once election jitters subside and when House and Senate majorities are aligned, which is the current prediction.
Events That Influenced Markets in October
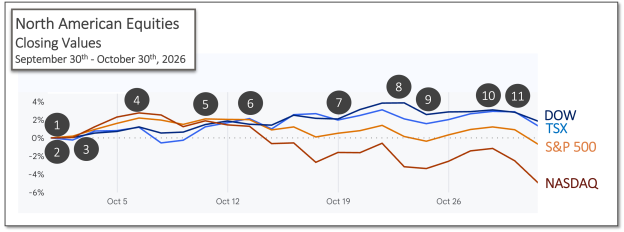
Source: Bloomberg and ARG Inc. analysis.
1. September 29 and 30 – Canada’s economy unchanged in July, while U.S. expanded
Real gross domestic product (GDP) was unchanged in July. Neither goods-producing nor services-producing industries generated growth in July. One bright spot was the construction sector which saw its fourth consecutive month of growth after rising 1.3% in July. StatsCan release
U.S. GDP increased at an annual rate of 2.2% in the second quarter of 2026 according to the third estimate by the Bureau of Economic Analysis. Previous estimates had pegged the economic growth rate at 1.5% for the same period but have been revised upward. BEA release
2. September 30 – U.S. inflation continued its rise
The personal consumption expenditures (PCE) price index, the U.S. Federal Reserve’s preferred inflation indicator, increased 0.3% in August, and 3.4% on a year-over-year basis. Core PCE, which excludes food and energy, increased 3.0%. Both headline and core measures are above the Fed’s 2% goal. PCE release CNBC and PCE
3. October 2 – U.S. employment growth stalled
The U.S. Bureau of Labor Statistics reported, “Both nonfarm payroll employment (+29,000) and the unemployment rate (4.2 percent) changed little in September.” The number of unemployed people, 7.1 million, and long-term unemployed, 1.9 million people, were also stagnant. Most industries saw limited gains or losses. BLS ESS release
4. October 6 – U.S. trade deficit grew, and Canada surplus expanded again
The U.S. Census Bureau and the U.S. Bureau of Economic Analysis announced that the goods and services deficit was $105.6 billion in August, up almost $13 billion from July’s $92.8 billion trade deficit. Imports jumped 4.3% and exports increased 1.4% during August. The trade deficit for goods increased to $137 billion while the service surplus was unchanged at $31 billion. BEA release
The Canadian merchandise trade surplus grew for the sixth consecutive month in August. Exports rose 2.5% and imports were down 2.0% to drive the surplus to $4.2 billion up from $787 million in July. Some of the increase is attributed to changes in the Canadian dollar since much of the trade is conducted in U.S. dollars and then converted or calculated in Canadian dollars. Nonetheless, exports increased in 8 of 11 sectors including a 17% increase in refined petroleum energy products. StatsCan release
5. October 9 – Canadian employment fell
Employment declined by 68,000 in September and the unemployment rate increased 0.1% to 6.5%. The decrease was split evenly between full-time and part-time employees. Losses were highest in Quebec and British Columbia, among youth and core-aged women, and in educational services, health care and social assistance, and manufacturing. StatsCan Labour Force Survey
6. October 14 – U.S. consumer inflation rose higher above goal
Consumer price index (CPI) increased 0.6% in September after rising 0.4% in August. Over the last 12 months, the all-items index increased 3.7%, up from 3.4% in August. The increase in September was driven by a 9.1% increase in the index for gasoline, which accounted for half the monthly increase. BLS CPI release
7. October 19 – Canadian consumer prices edged upward
The CPI rose 3.1% year-over-year in September following a 3.0% increase in August. Gasoline led the increase in the headline inflation rate; excluding gasoline, CPI rose 2.2%. Core CPI which excludes energy and food was slightly higher at 2.4%. StatsCan CPI release
8. October 22 – Producer price inflation jumped in Canada
“Prices of products manufactured in Canada, as measured by the Industrial Product Price Index (IPPI) rose 2.0% in September and gained 14.5% year over year”, according to the latest IPPI release from StatsCan.
9. October 23 – Retail sales maintained strong pace
Retail sales in Canada rose 1.2% in August. Total sales reached $74.6 billion after all nine subsectors and six provinces increased, led by increases at motor vehicle and parts dealers. It was a turnaround from July’s 0.7% decline. StatsCan retail sales
10. October 28 – Central banks announced interest rate decisions
The Bank of Canada, which faces a difficult task to speed up a slowing economy and slow down increasing inflation, raised interest rates for the first time in three years. The policy interest rate, the overnight rate, increased 0.25% (25 basis points) to 2.5%. BoC release CBC and BoC
The U.S. Federal Reserve’s Federal Open Market Committee “decided to maintain the target range for the federal funds rate at 3¾ to 4 percent” in their statement on Wednesday afternoon. A rate increase was not expected, but it is predicted for December 9 according to CME’s FedWatch tool.
11. October 29 – U.S. inflation rose again
A U.S. Federal Reserve rate “hold” occurred despite the U.S. Bureau of Economic Analysis reporting the PCE price index rose 0.5% in September and 3.6% since last year. PCE is the U.S. Federal Reserve’s preferred inflation measure and sits above the 2% goal. BEA PCE release BEA GDP release
Thank you for your continued trust. If you have any questions about this update or would like to discuss your portfolio, please reach out to our team.