Puppy Zoomies and Market Zoomies
Hubble gets the zoomies. Briana’s golden retriever puppy just can’t help himself, he needs to run and run in circles and then collapse. Few things are as much fun as watching a puppy with the zoomies—but don’t take my word for it, watch this weeks video to see for yourself!
Turns out investors sometimes get the zoomies too. March has seen investors running in circles first selling then rebuying stocks. It’s actually the hedge funds and a group called the Commodity Trading Advisors (CTA) who do the most running. That’s largely because they are leveraged and can’t “wait out” the occasional corrections. For these investors (particularly CTAs), their investment rules dictate selling when the stock market falls. That creates a feedback loop that pushes stocks down even further—but that process works the other way too!
Why March Is a Complicated Month for Markets
March is a particularly complicated month because it is the end of a quarter and pension funds often do their rebalancing at quarter end. That means it’s time to buy stocks, particularly when stocks have fallen in the quarter. Combined pensions and CTAs are expected to be adding a substantial amount to U.S. stocks between now and the end of the month. Net result—the stock market has the zoomies.
The charts below illustrate the circles that investors have been running in, (the photos of Hubble and Rumble are entirely gratuitous “fluff” 😉):
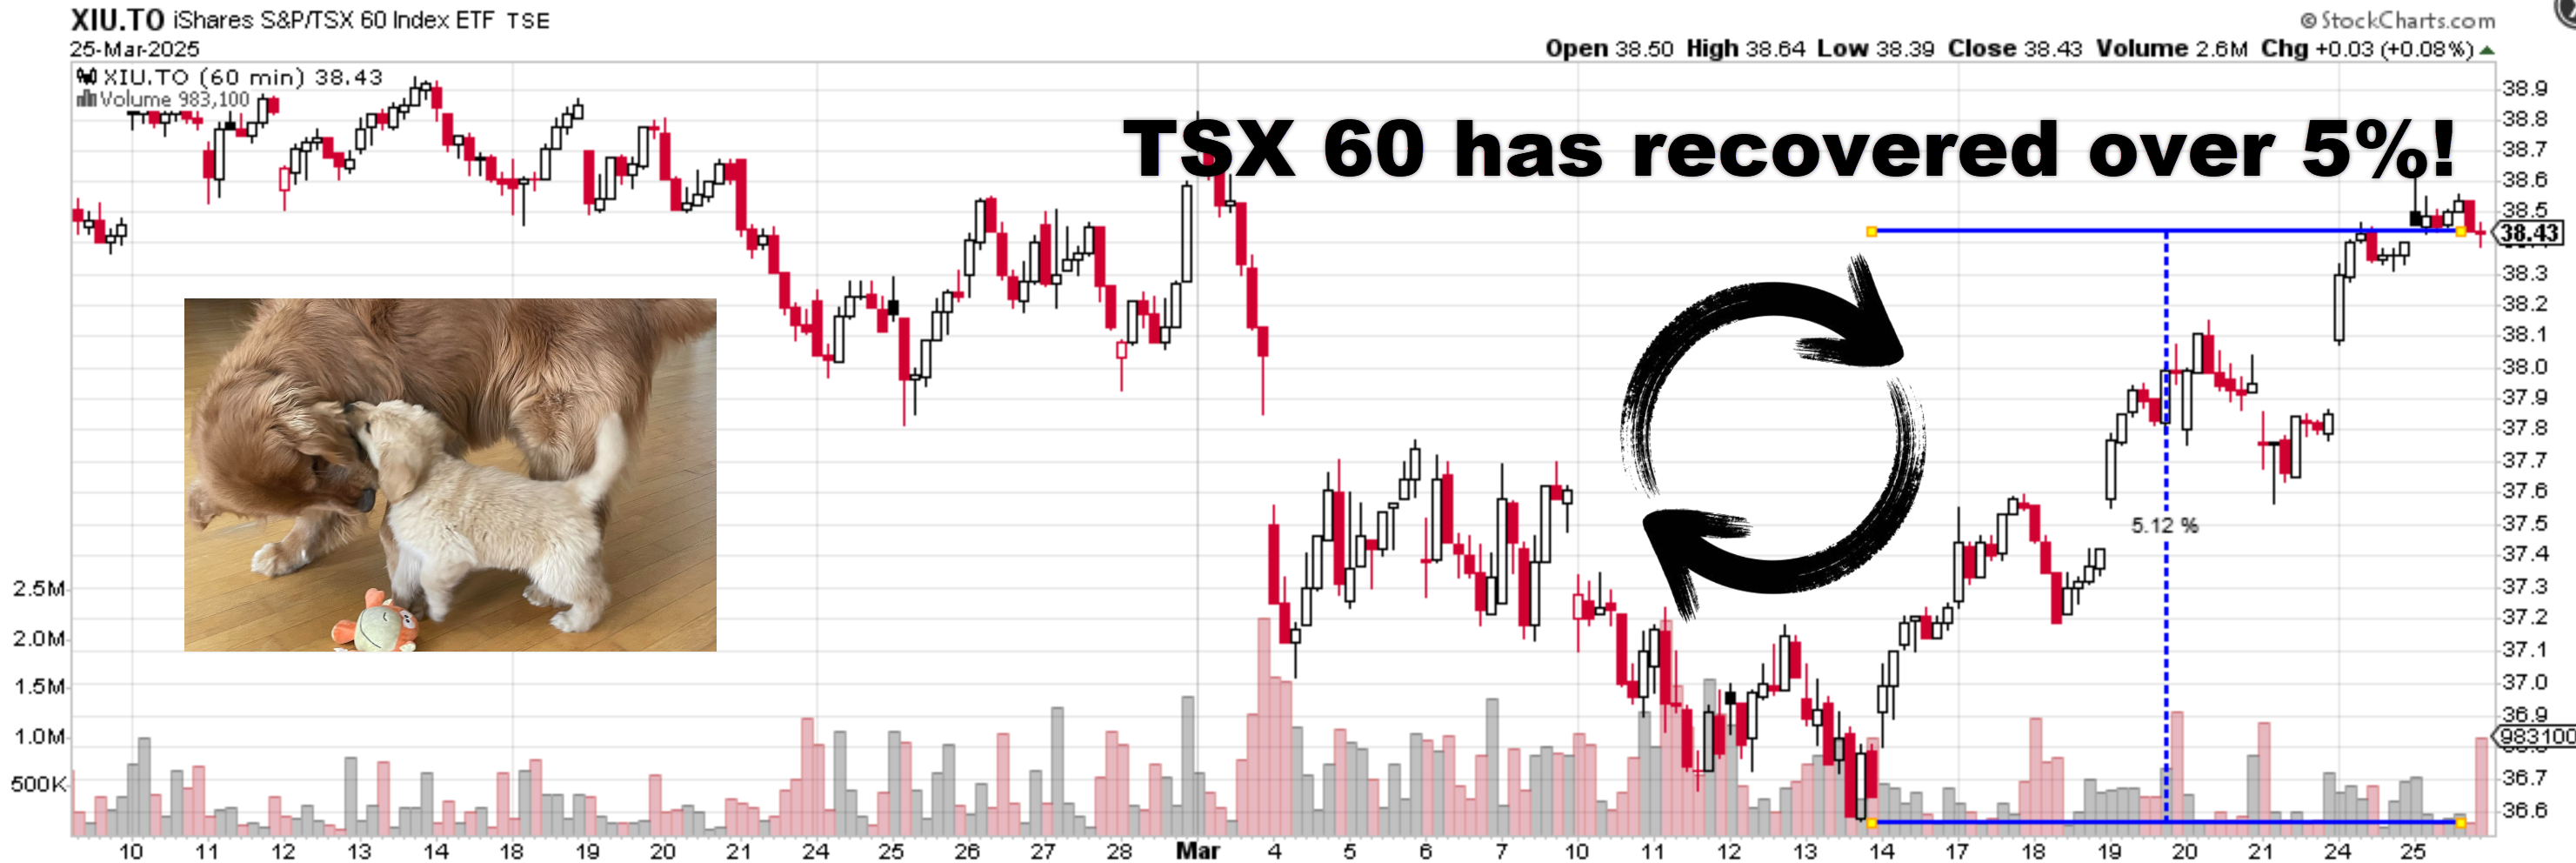
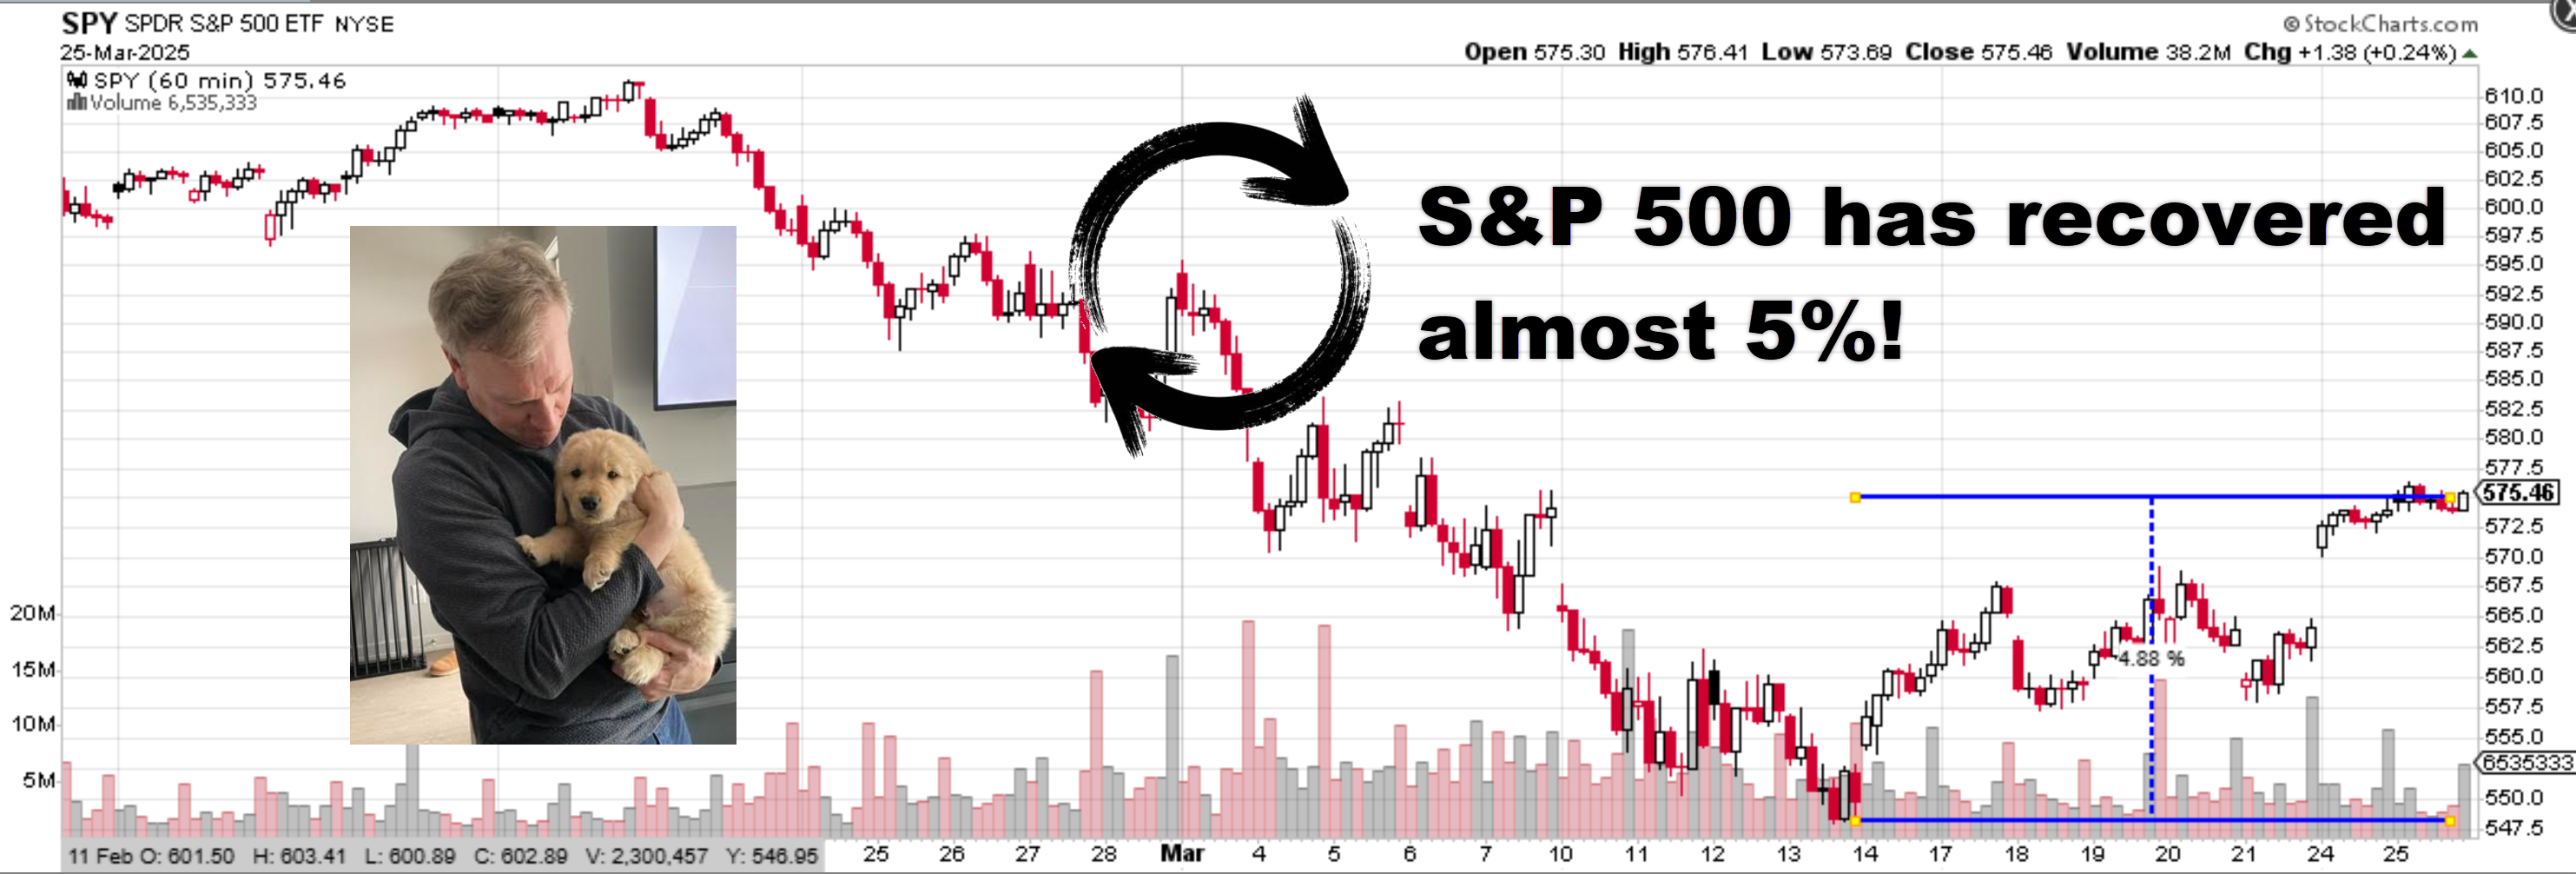
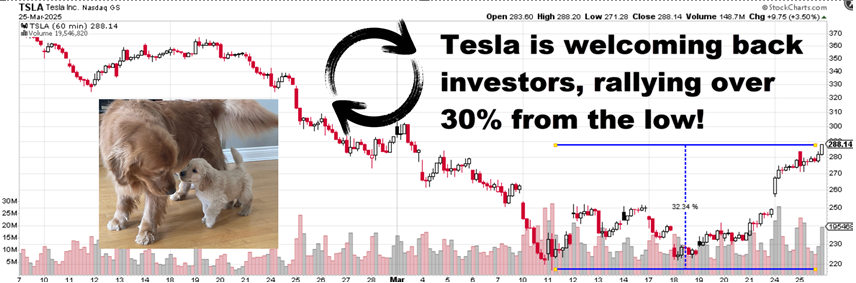
Charts courtesy of StockCharts.com
Why Smart Investors Don’t Chase the Market
Experienced investors, like puppy owners, know not to try to chase a dog doing the zoomies! They’ll come back when they’re tired!
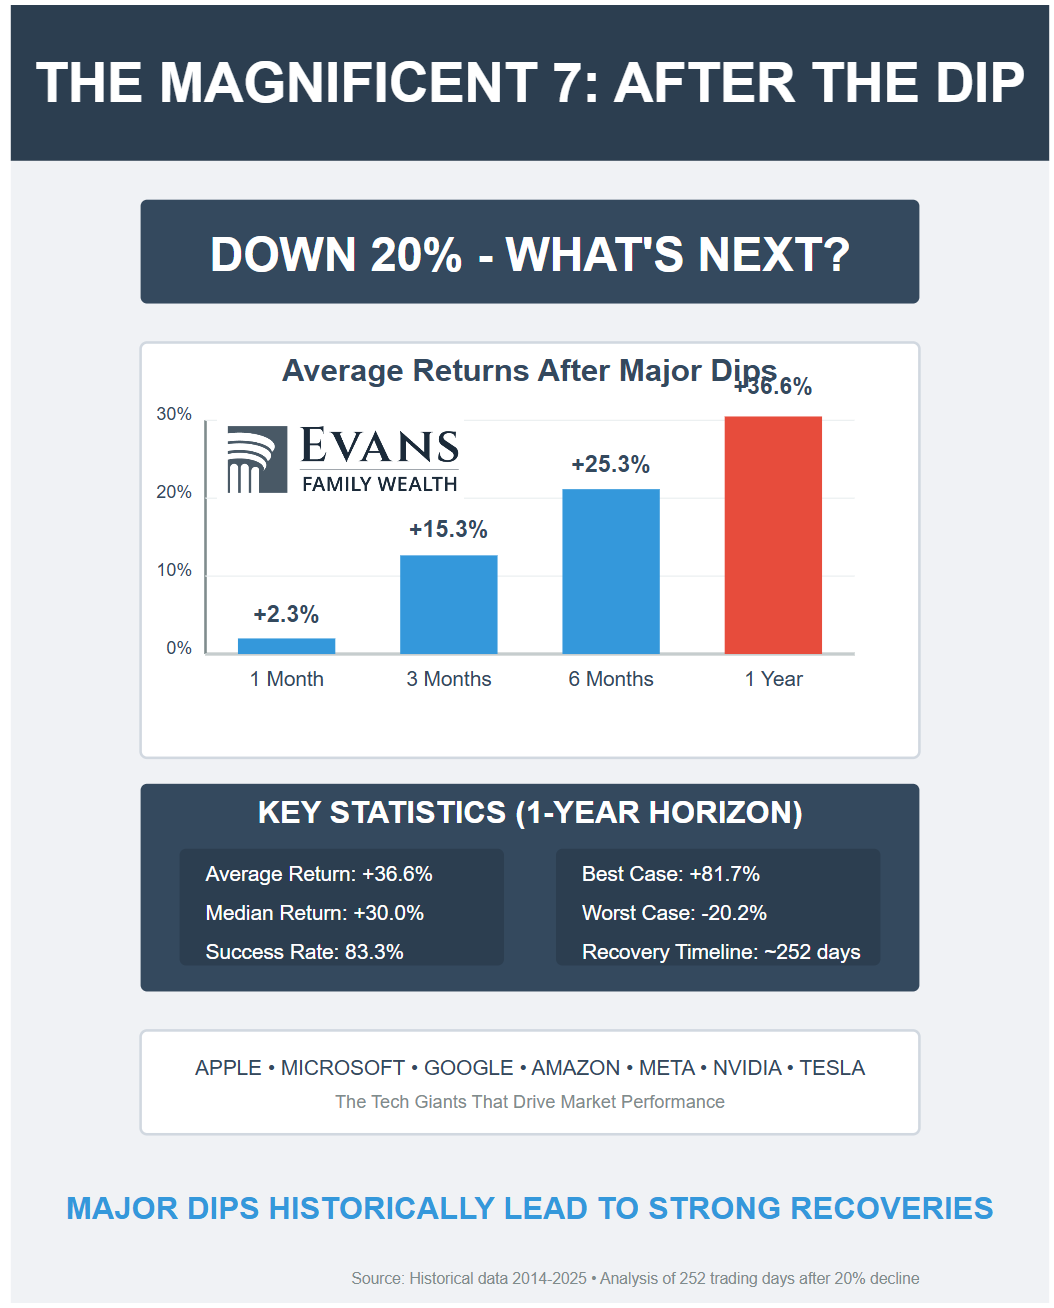
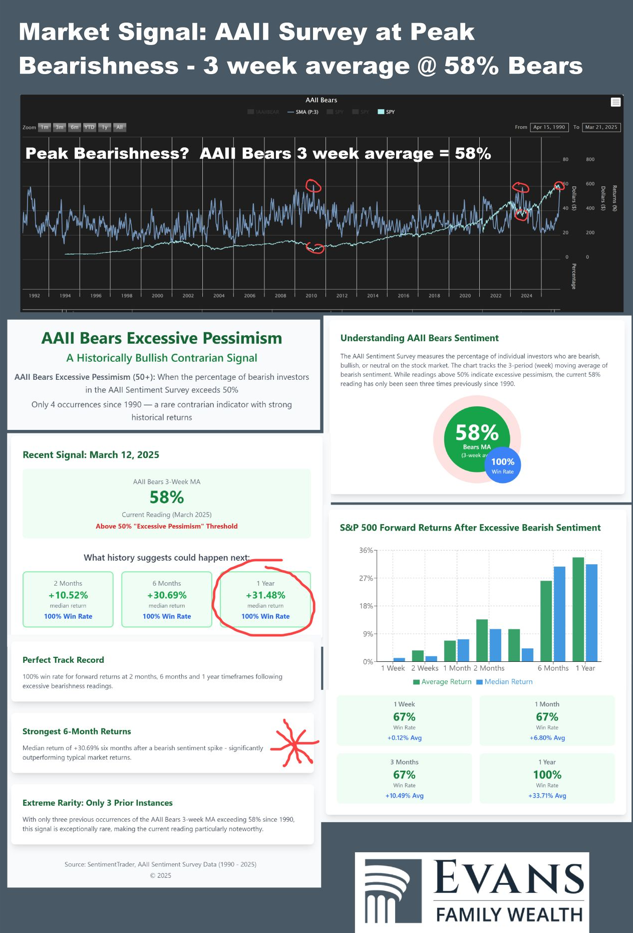
I’ve been writing about this the last several weeks, pointing out that after the sharp drops we’ve seen, we should expect rallies rather than more selling (except in the case of recession). Here are two indicators I shared on LinkedIn and X. This month the Magnificent 7 stocks fell 20%—on average the 1 year return following declines of 20% or more is 36.8% for the group! Similarly, we’ve seen a peak in bearish sentiment—in March, the American Association of Individual Investors (AAII) survey registered 58% bears! The forward return for the S&P 500 from that setup—up 31.48%. Zoomies!
source: FRED
Economic Uncertainty and Market Opportunities
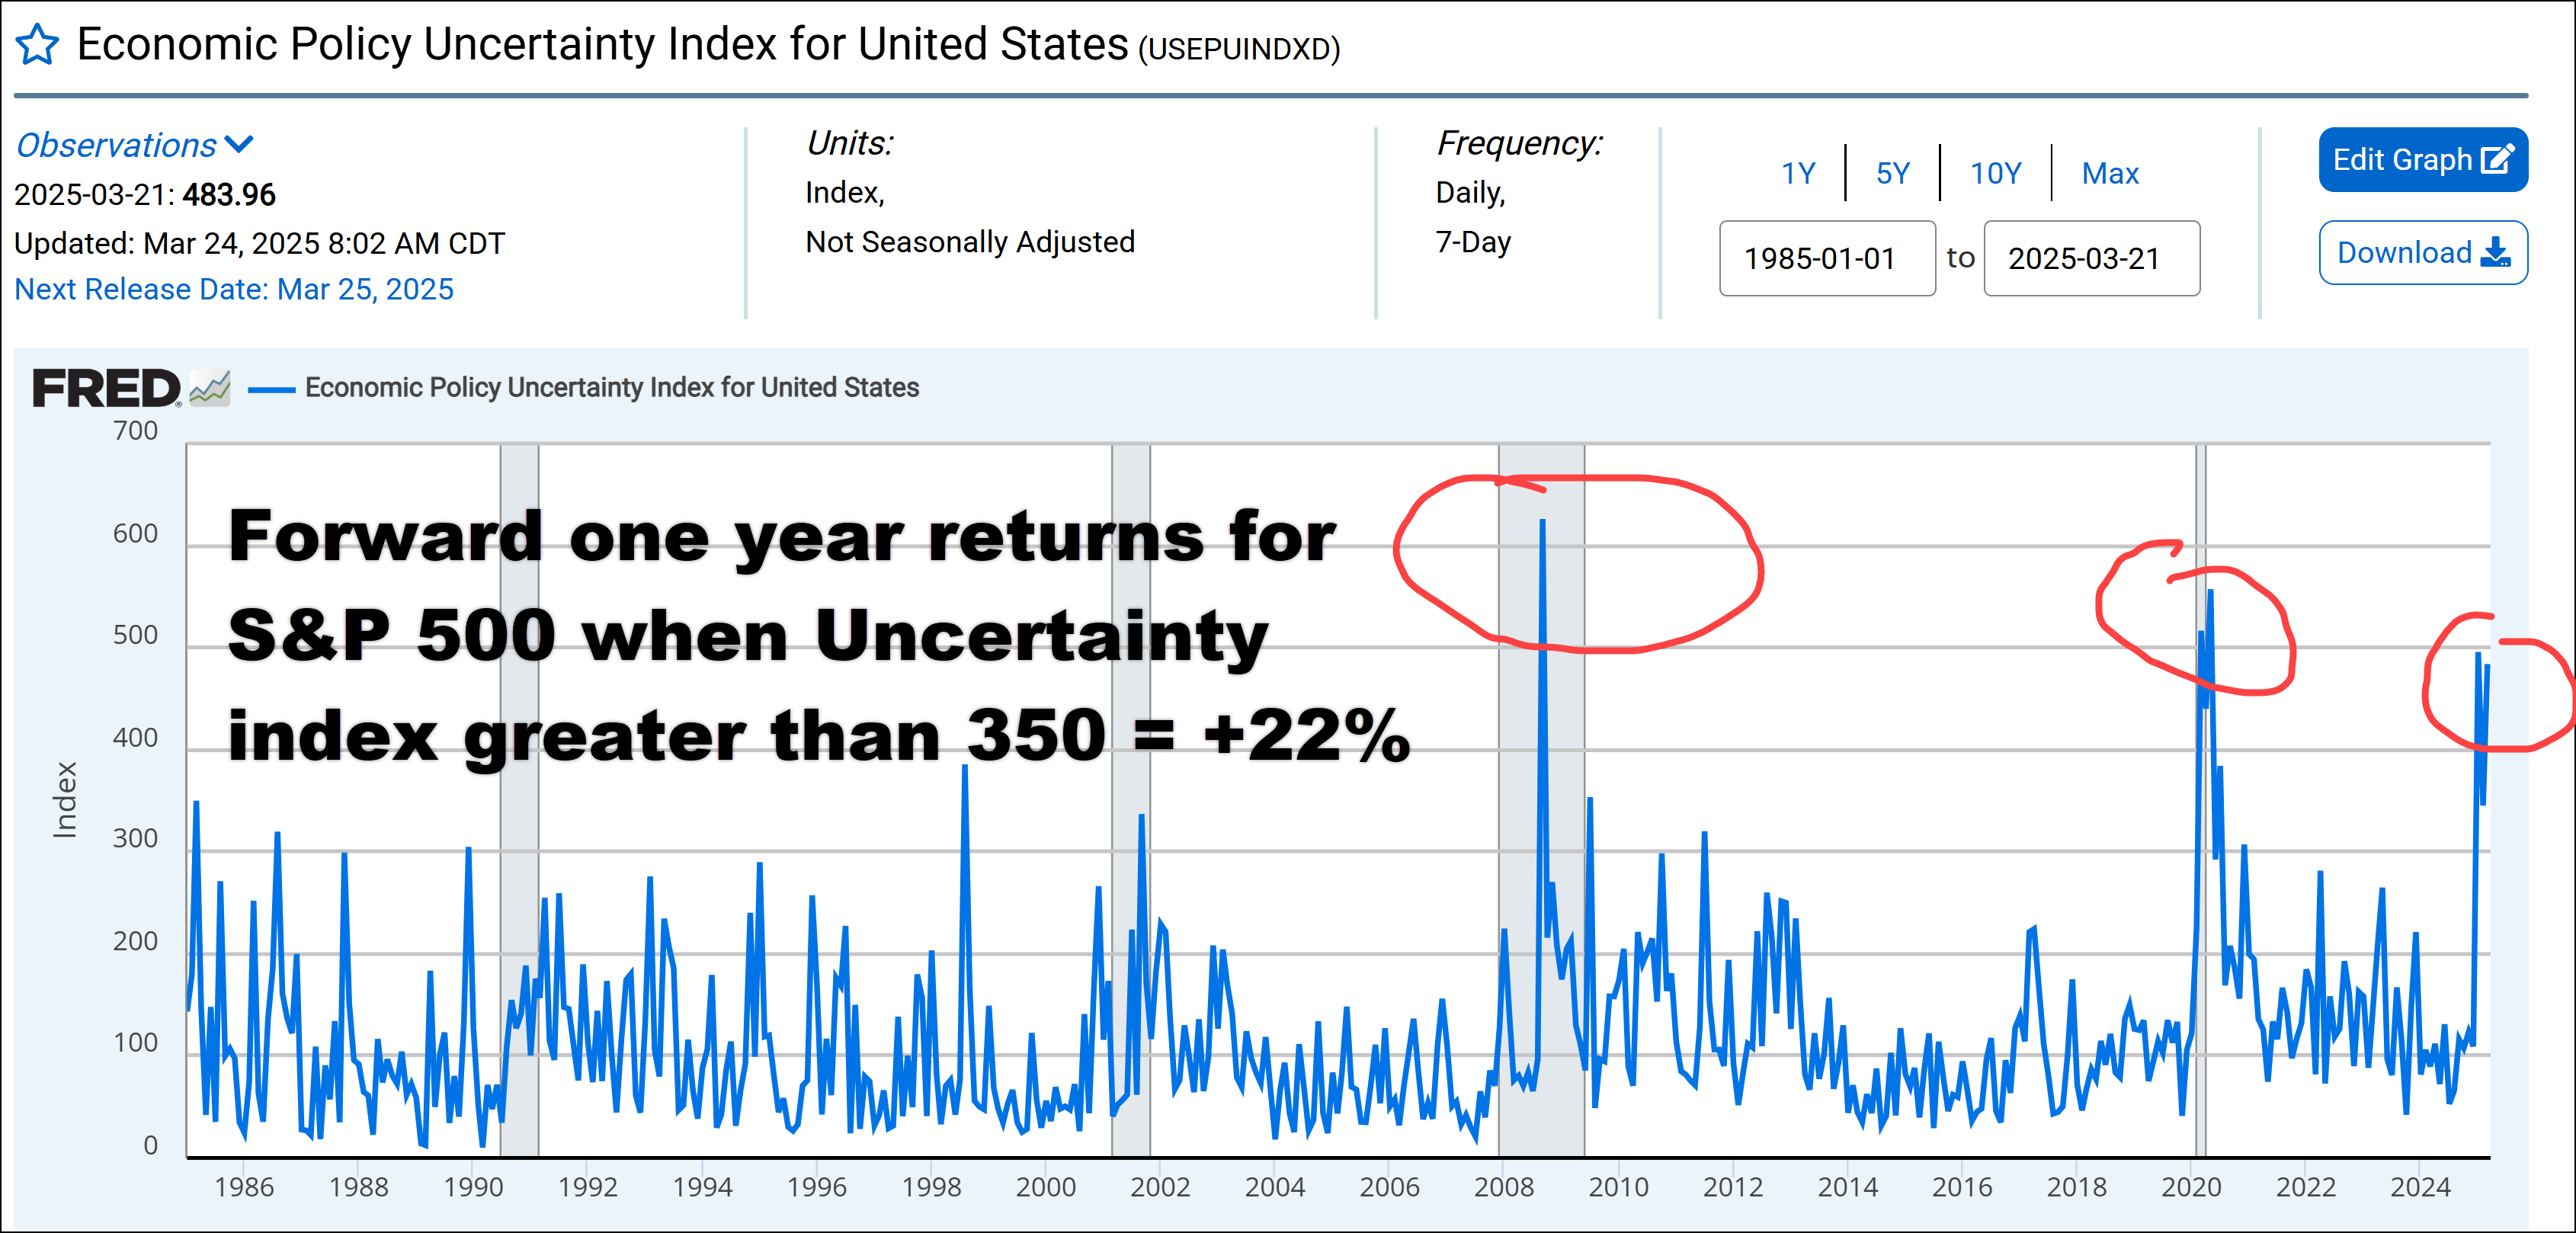
My message here isn’t that we can’t see more market weakness. I’m also not discounting the fact that risks are mounting with the economic weakness that President Trump’s erratic messaging is creating. This economic slowdown will worsen if the administration doesn’t provide clarity soon. That said, uncertainty is always present when markets correct. The Policy Uncertainty Index is currently spiking, matching prior peaks in the Pandemic and the Great Financial Crisis. That uncertainty pushes prices lower but sets up for excellent one year returns of over 22% for the S&P 500. Do you see it now? Markets are like puppies—they go around in circles! The trend though is higher over time.
Patience Is Key in Investing
We have made prudent changes in the managed accounts just as the managers of your mutual funds have done—that’s our job. Generally though, the task of the investor is to watch the market do its zoomies and stand pat. I’ll close with one more gratuitous puppy photo!
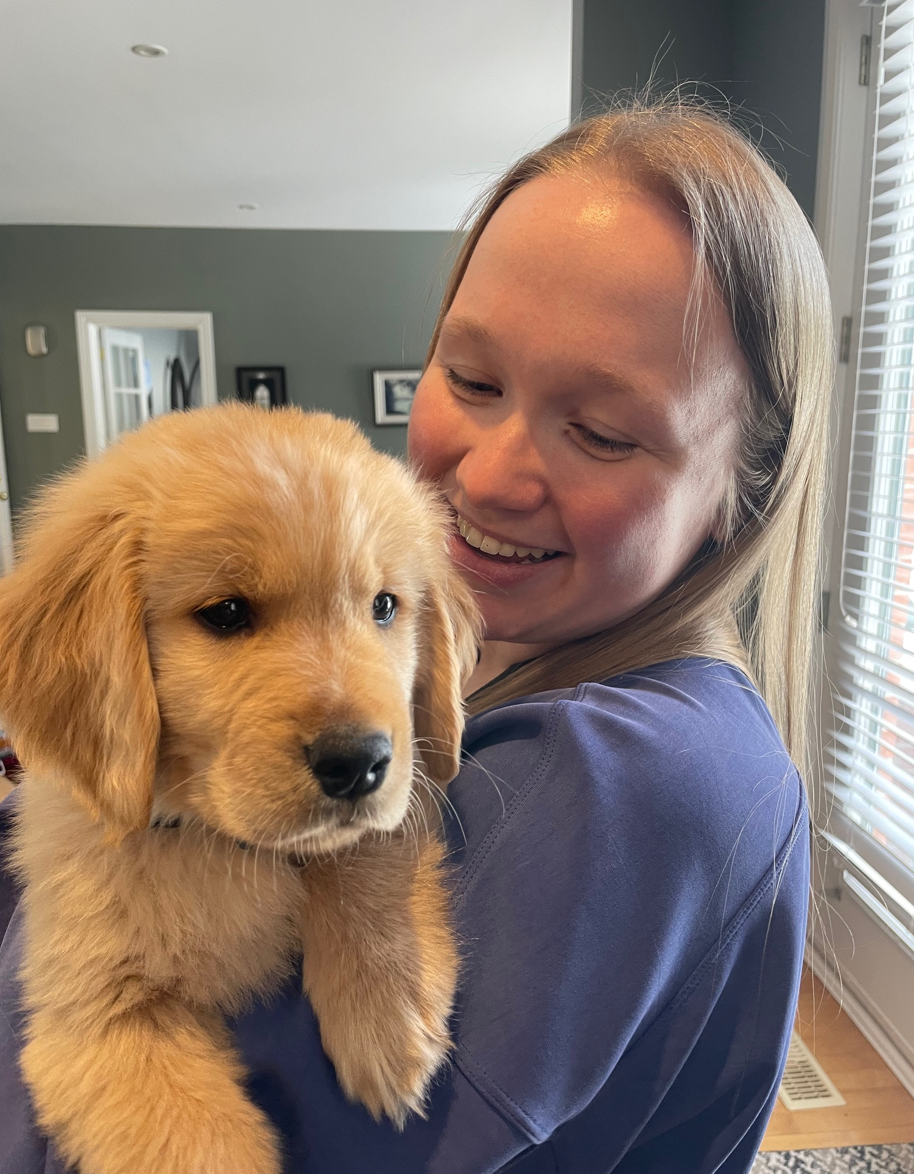
Briana and Hubble—Best Friends
Watch the Video: Market Zoomies: March Madness in the Stock Market
Want to hear Glen’s take in more detail? Check out our latest video on YouTube and subscribe to stay up to date.
Glen