“Patience is a virtue”
-poet William Langland
Time to Take the Temperature

Our August 31st Gold Seal newsletter told the story of a North American stock market figuratively reaching the end of a whimsical summer and reluctantly returning to the classroom as it began to awaken to some harsh economic lessons. Indicators aside, an optimistic sentiment had clearly been in the air through the first half of the year as imaginations and valuations ran wild with the limitless potential of artificial intelligence and the adoption of ChatGPT. The companies most directly associated with this tech “mystery box” of productivity responded accordingly, driving the meteoric rise of chip manufacturer Nvidia ($NVDA) to the podium of U.S. heavy weight stocks alongside longtime residents such as Microsoft, Apple and Google. To the end of May 2023, the five largest stocks in the U.S market ($AAPL, $MSFT, $GOOGL, $AMZN, $NVDA) had accounted for 78% of the market’s total year-to-date gain and pushed all worries about high rates and inflation into the rear view. The third quarter of the year represented an abrupt season change and as below, our market clearly didn’t make it one month back in the classroom before coming home with symptoms of a cold:
Source: Aswath Damodoran, “Market Bipolarity: Exuberance versus Exhaustion” NYU Stern School of Business Oct. 4 2023
Now that my statute of limitations on this information has expired, in truth, there were times in school where my self-described cold symptoms were less legitimate and rather an excuse to stay home for the day. Just like then, it’s also important now to take the market’s temperature to determine if the ill-returns felt in the last quarter are symptomatic of something serious and lasting, or just enough to justify sleeping-in that morning but still going trick-or-treating.
Taking the temperature of the market, investors don’t appear to be afraid, but rather bored. Generally, investors who are worried about the risk of a particular bond or stock will demand a greater return for investing in it, such that they’re adequately compensated for the particular risk. For the rational investor, that would imply that the greater the perceived risk, the higher the demanded return. That additional demanded return is typically measured by two key pieces of data: corporate default spreads for bonds, and the equity risk premium for stocks. Both measures have held relatively stable throughout the year, with the equity risk premium in the U.S. actually moderately declining on the year. For those not fluent in “analyst”, all this means is that investors are not perceiving any more risk in the markets now than they were through the first half of the year. With fear ruled-out as a cause for the symptoms we saw last quarter, we’re left with one other likely culprit: boredom with the companies driving performance.
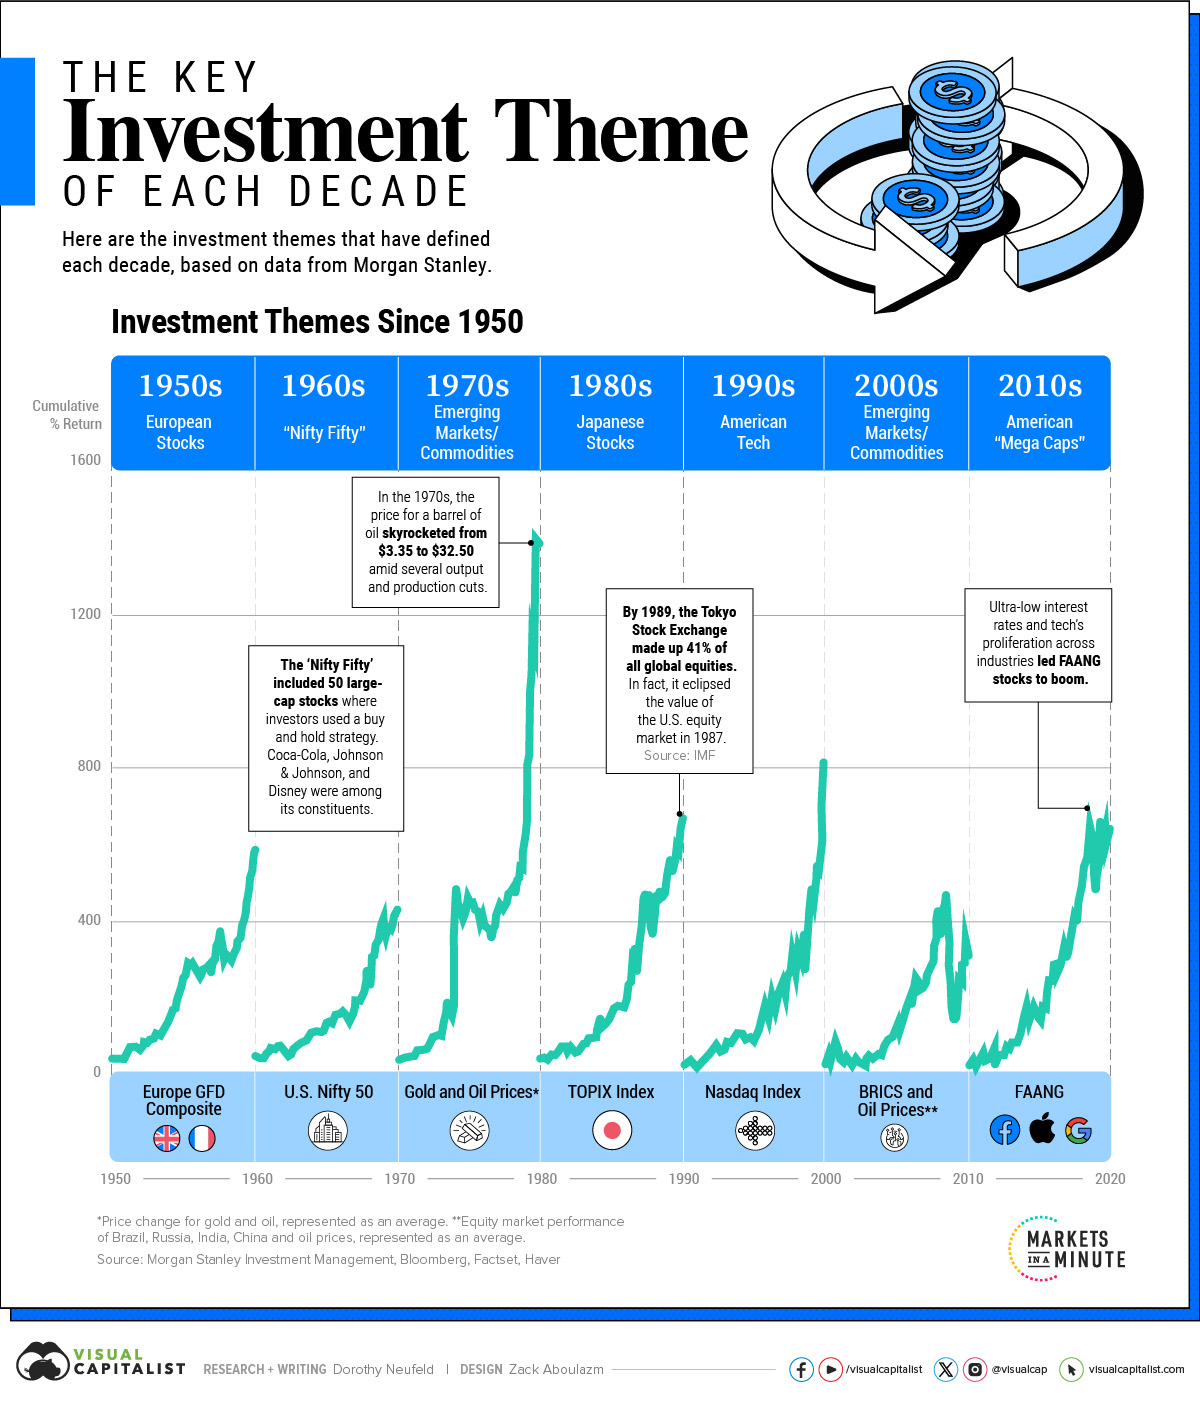
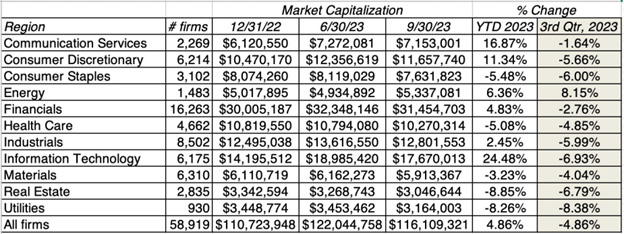
Presently in the S&P500, the top 10 largest companies account for over 31% of the market by size, with the top 5 accounting for most of the overall market’s return. It naturally follows that price movements specific to the company of any of these constituents are going to have a larger impact on the market as a whole due to size. As a recent example, two of these very large constituents, Nvidia and Tesla, have taken respective losses of -17% and -22% since August 31 (to October 31st). These are not investors selling down their shares of the company because they’re worried about the economic state of the U.S. or its market, rather they’re investors that had too lofty expectations for the adoption of artificial intelligence (AI) or electric vehicles. Lofty expectations were set and boredom results when the explosive anticipated growth fails to materialize. That’s a normal part of market growth, and history shows that it’s possible to have a healthy overall market even while its largest names fall from favour. That’s actually more often the case, and there has never been a time when the top 10 largest companies in the market have remained the same from decade to decade:
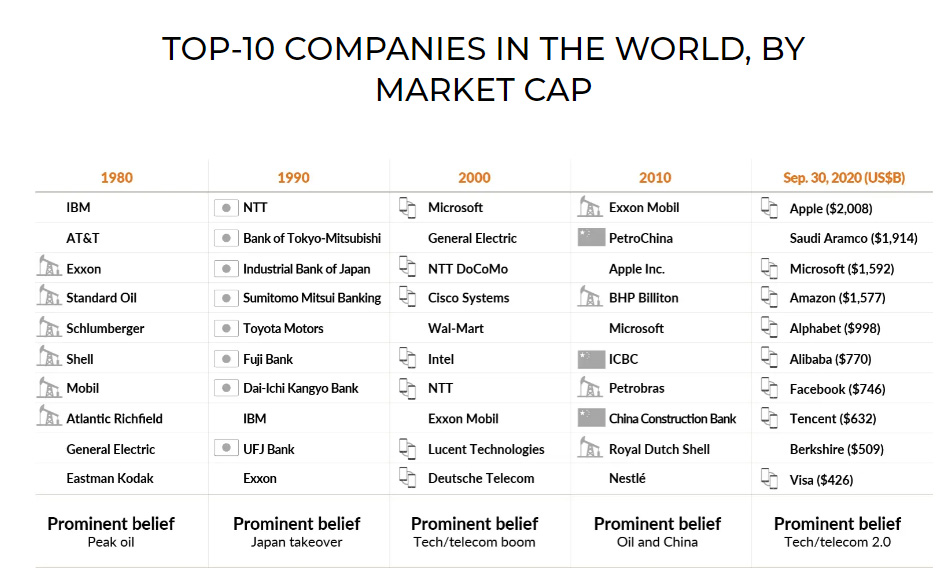
Source, decades: J. Mauldin, “Bonfire of the Absurdities”, Mauldin Economics, November 17, 2017, http://www.mauldineconomics.com/frontlinethoughts/bonfire-of-the-absurdities/. Source, 2019: Bloomberg LP. Market cap in US$.
Further, while the market grew exponentially over the period above, your best buys were rarely made with the largest names. The below shows the future 5 and 10 year returns for companies in the U.S. that held a weighting accounting for more than 3% of the market at the time.
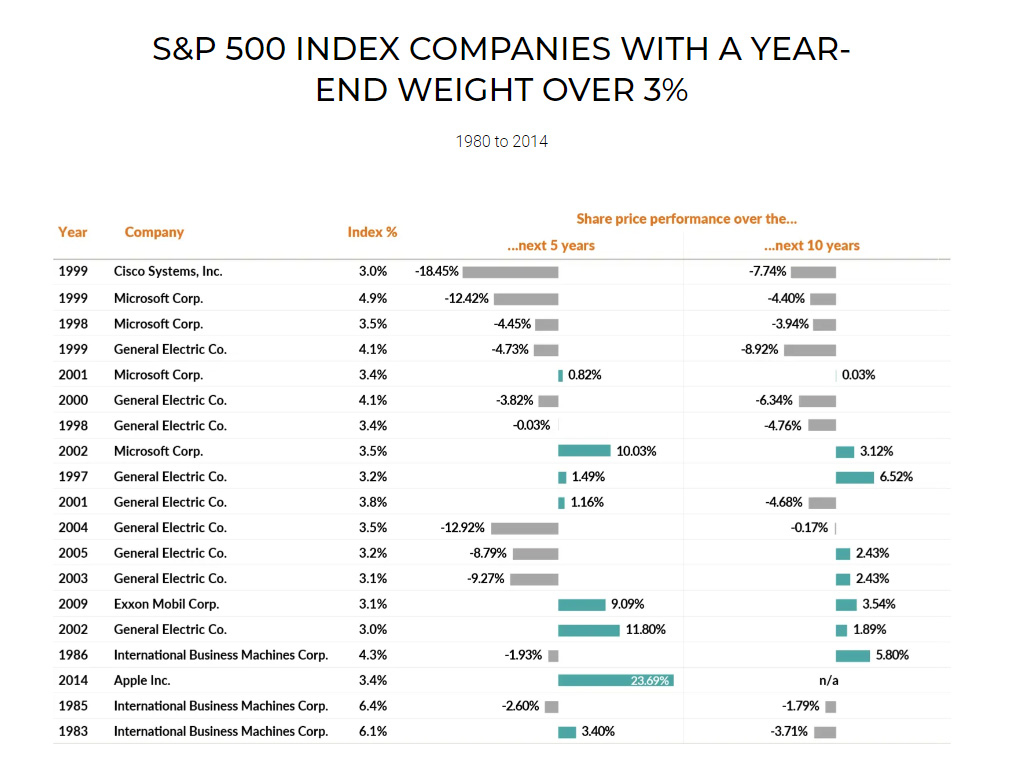
Source: https://edgepointwealth.com/article/the-certainty-of-uncertainty-3rd-quarter-2020/
It bears repeating, “if the company is already large, it’s not on sale”, and the above clearly demonstrates why buying into already high valuations hoping to go higher has been compared to picking up pennies in front of a steamroller.
With the return concentration in the U.S. market now twice what it was in even 2020, the performance of these companies becomes less useful to gauge the health of the market overall. That said, there is plenty of room and opportunity for the capital currently saturating these select names to re-distribute into more attractive, high value opportunities across the broader S&P500, as well as mid-capitalization and small-capitalization stocks that have so far produced stagnant returns for the year.
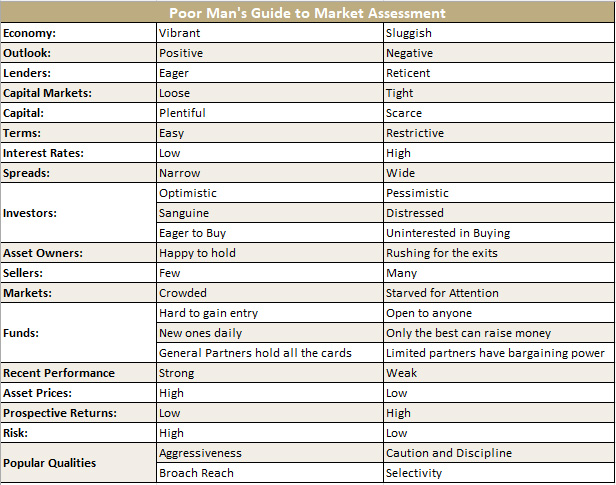
With concentration muddying our temperature reading on the overall state of the North American markets, we must look to broader measures. One timeless checklist that often helps our team make our assessments on market health comes from renowned bond investor Howard Marks, who authored the below “Poor Man’s Guide to Market Assessment” in his most famous collection of memoirs. He suggested monitoring these areas of the economy and market, with answers towards the right-hand side of the column suggesting ideal buy-time conditions, and answers skewing towards the left-hand column suggesting it was time to hang on to your wallet. You can perform the simple exercise yourself – go through the checklist below and for each row, check off the characteristic that you think is most descriptive of today:
Our score-cards on the above for Canada and the U.S. are continuing to diverge and suggest that Canada’s time of keeping lock-step with the U.S. on interest rate policy may now be at an end. While the U.S. economy surpassed inflation expectations with 4.9% growth for the third quarter, Canada’s September estimates show a sputtering economy that is likely to post a second consecutive quarter of contraction. By many economists’ definition, that is technically recession territory. While our own Bank of Canada has upgraded their growth outlook for the United States for this year, their October monetary policy report painted a less than ideal picture for Canada with 1% real GDP growth for 2023, just under 1% for 2024 and 2.5% in 2025. While on the surface those figures appear to be positive growth, we must be prudent in considering that Canada’s population is expanding at a record pace of 2%-3% per year over this time period, resulting in three full years of negative GDP per capita. The only time in history that this has occurred was from 1990-1992, which was characterized by a Canadian recession lasting eight quarters, where the loonie lost ground against the U.S. dollar and oil prices surged. The Loonie lost three cents against the U.S. dollar in October 2023 alone, but thankfully the Q3 spike in oil prices has now subsided. Beyond the sluggish economy and negative outlook, other stains on our Canada scorecard include reticent lenders (banks), high rates that result in scarce capital, weak recent performance causing pessimistic investors, reduced risk appetite and excess caution.
Furthering concerns within the Canadian landscape, a report by RBC released this week raised concerns over the mounting mortgage debt bubble coming due in the coming years. According to the report:
- 60% of outstanding mortgages issued by Canadian chartered banks are coming due in the next three years.
- These mortgages account for over $900 billion in debt, renewing at the highest rates since 2001.
- $186 billion of this is up for renewal in 2024, $315 billion in 2025 and $400 billion in 2026.
- Those renewing in 2025 could be facing average payment increases of 33%. If rates were cut by 1%, the payment increase would still be 20%.
- Those renewing in 2026 could face an average 48% increase in payments, with variable mortgage holders facing the largest increases of up to 84%. Bringing these variable holders down to a still-unsettling 20% payment increase would require rates to be cut to 0.25% by 2026.
Canada’s temperature check leads us to believe that the symptoms we’re monitoring are problematic. Our market isn’t likely to be trick-or-treating quite yet, and to say that we feel validated in further reducing our exposure to Canadian stocks back in September within our Gold Seal Serenity models is an understatement. Moving forward, just as the Bank of Canada is cautiously awaiting further signs of default before reversing their course on interest rates, our team is awaiting further signs of distress before deciding to re-enter our Canadian exposure at normal levels. The conviction that we are positioning for is that Canadian rate cuts will have to be more substantial than is presently priced into bond and stock valuations, and given the looming mortgage debt bubble, we do not see any alternative beyond that solution that doesn’t result in severe recession. If you’re a client that is vacationing in the coming months, we would encourage you to buy your U.S. cash now.
In international temperatures, previous concerns within the Chinese economy remain amid rampant default of troubled property firms such as Country Garden and Evergrande, while state governments scramble to refinance existing debt. Liquidity problems have arisen, forcing the People’s Bank of China to intervene in debt markets on Tuesday last week as rates surged out of control, with the state blaming the cause on significant issuance of government bonds, and “unidentified financial institutions”. To abandon our economic jargon, there just seems to be something under the hood in this economy that is giving us the heebie-jeebies this October and we’re going to continue to screen-out our exposure there for now.
Oil remained a strain on the war on inflation, with prices of WTI crude surging through Q3 on news that OPEC+ would be continuing production cuts through to 2024 amounting to 3.6% of global demand. Simultaneously, Biden’s outspoken support of Israel in the conflict in the Middle East brought back flashbacks for investors of 1973-1974 oil embargos that resulted from the U.S. resupplying of the Israeli military. The knee-jerk response was a surge in oil prices, which now appears to have subsided as most key oil-flow routes are not directly impacted by the conflict.
Clearly, temperatures across our readings are not all even-handed and extra caution is presently warranted in some of the markets in which we invest. We have defensively positioned to capture elevated fixed income returns given our high-rate environment and maintain bond positions poised to produce capital gains when rate cuts prove substantial. Our alternative investments such as precious metals have proven defensive this year, offsetting Canadian stock weakness. We’ve held onto U.S. stocks that have produced average returns this year, even after entering a correction erasing 10% from their summer peaks. What is common across our temperature checks is that as restrictive policy and high rates put pressure on companies, markets are shifting from rewarding momentum and concentration, to rewarding those that have done their homework. As long as you’ve done all your homework, it doesn’t matter as much if you stay home a day or two with a fever.
Banking Update: New Capital Guidelines Amid Rising Mortgage Risks
It was recently announced that the Office of the Superintendent of Financial Institutions (OSFI) is now requiring lenders to increase their capital reserves. This change, effective from November 1, 2023, is in response to the growing risks in the mortgage market, fuelled by soaring interest rates.
Rapid interest rate hikes by the Bank of Canada – now at a 22-year high of 5% – have significantly impacted the near $2 trillion mortgage market. Many homeowners have mortgage payments that only cover the interest on their loans, causing extended mortgage repayment periods, known as negative amortization.
To combat these risks, Canada’s six major banks have set aside approximately $3.5 billion for bad debt provisions in recent earnings, contributing to a total reserve of $9.45 billion over the first nine months of 2023. This is a significant increase compared to the previous year.
Despite these challenges and a noticeable drop in the value of shares for these banks (ranging from 3% to 12% this year), Fitch Ratings has indicated that the sector can absorb these changes with minimal impact. Importantly, these new guidelines are not expected to increase monthly mortgage payments for existing borrowers.
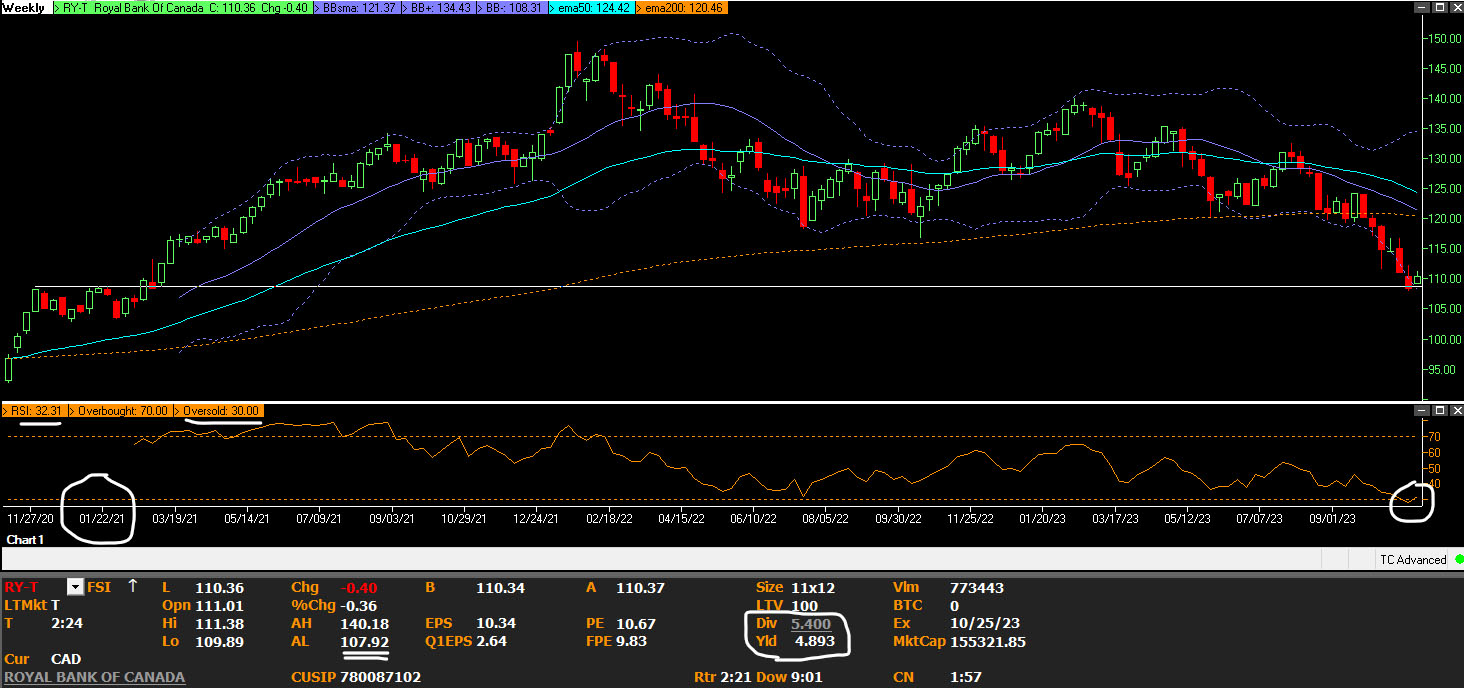
The following 3-year chart (as of November 1st 2023) illustrates the recent pull-back in Royal Bank (RY), bringing us back to March 2021 pricing. On the left side of the chart, I’ve underlined RSI (Relative Strength Index) of 32.31. A reading of 32.31 suggests that Royal Bank is fairly oversold here and could be a buy. Royal Bank currently pays a dividend yield of 4.89% per year which is attractive. For the patient investor, the annual income received is worth the wait for recovery. Interestingly, Bank of Nova Scotia (BNS) is currently paying a dividend yield of 7.56%. We haven’t witnessed dividend yields this high on the Canadian banks since 2008. Although there is likely more pain to be felt in the Canadian banking sector as they navigate through the mortgage issues described above, the banks are well capitalized, which should assure the long-term investor.
Gold Seal Insights

Tanya’s Tips: Rethinking GICs – the risk of “no risk”
In light of the recent upswing in the popularity of Guaranteed Investment Certificates (GICs), it’s crucial to understand their true place and value in your investment strategy.
The Resurgence of GICs
Thanks to global central banks’ interest rate hikes, short-term lending rates have soared, making GICs seem more attractive now than they’ve been in years. But the key question remains: Are GICs really a good investment choice right now? Simply put, for most investors, the answer is no.
When GICs Make Sense
If you’re facing a known financial obligation in the next 6-12 months, a GIC is a wise parking spot. In these cases, GICs are undoubtedly the recommended choice, regardless of whether interest rates are at 1% or 5%. Aside from short-term cashflow or expense needs, however, it’s hard to justify the benefits of a GIC.
Understanding GICs: A Closer Look:
- Low Returns, High Gains for Banks: GICs, issued by banks and financial institutions, offer lower GIC interest rates while the issuers lend out at higher rates – a lucrative model for them, but less so for investors.
- Inflexibility and Lower Returns: The often non-redeemable nature of GICs makes them a rigid investment compared to other most other investment options. Redeemable GICs don’t necessarily improve this situation since they offer significantly lower returns compared to the non-redeemable options.
- Tax Inefficiency: GICs within non-registered accounts are fully taxed, prompting a significant chunk of your returns to go to the Canada Revenue Agency. GICs are highly inefficient from a tax perspective.
Investor Horizons and GICs:
- Long-Term Investors: Historical data overwhelmingly suggests that GICs underperform compared to asset classes like stocks or bonds over the long term. Moreover, using GICs as a tool for market timing (moving from the stock and bond market temporarily until the outlook improves) is a frequently debunked strategy.
- Mid-Term Investors: For those looking at around a five-year investment horizon, remember to compare like with like. Comparing one year’s loss in the stock market (such as in 2022) against a five-year guaranteed GIC return is misleading. It’s faulty logic to compare a 1-year return with a 5-year return as well as comparing future returns against historical returns. In reality, you must compare returns at the conclusion of the term, not the beginning and when you consider a diversified portfolio including bonds and equities, over five years, such combinations have outperformed GICs most of the time, particularly after factoring in taxation.
- Short-Term Investors: With current trends showing short-term GICs offering higher interest rates than longer-term ones, the market seems to be betting on falling interest rates. The important consequence of this is that when interest rates go down, and they will, reinvesting matured GICs in the future will yield lower returns. Interestingly, when interest rates go down, bond prices go up. This puts GICs at a disadvantage compared to bonds.
Real Cost of “Guaranteed” Returns
In reality, the true value of a GIC should consider the inflation rate. For instance, if inflation outpaces your GIC’s return, your purchasing power decreases, not a favourable outcome for what is perceived as a “guaranteed” investment. It is often said that GICs are the only asset class that “guarantees” losses when factoring in inflation and taxation. This can be demonstrated below:
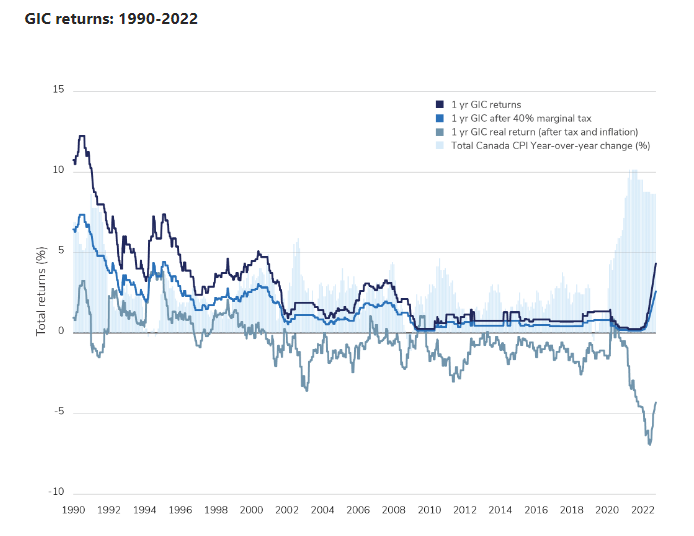
Source: Mackenzie Investments, Bloomberg. As of September 30, 2022. Guaranteed Investment Certificates (GICs) rates reflect average GIC rates from chartered banks. Note: “Real return” reflects nominal return less marginal tax rate at 40% and inflation rate.
A Wiser Approach: Diversification
To mitigate the risks and limitations of GICs, diversification across various asset classes (like bonds, equities, and even alternative investments) can create more balanced portfolios with better return profiles and fewer negative periods.
Conclusion: Looking Beyond GICs
Considering the last 40 years, a well-structured, conservative portfolio has typically offered better returns compared to 5-year GICs, even after accounting for fees. Therefore, while GICs may seem like a straightforward and secure option, they often do not align with the optimal long-term growth strategy for your investments.
As always, we’re here to discuss your specific financial goals and how best to achieve them, considering the entire landscape of investment opportunities beyond GICs.
Ryan’s Rationale:

The best investment opportunities will often feel the absolute worst to buy.
Imagine going to the grocery store, but instead of bargain hunting, you flock to the brands that have had recent price increases or are the most expensive. These brands are popular and you’re likely going to pay more than the actual good is worth.
Investing focuses on value, which is the difference between the good’s current price, and what it’s worth. If the item has a lower price than its value, that’s a discount. Discounts arise because that item is out-of-favour and the perception becomes that it’s inferior.
Buying (or investing) in what most view as inferior feels uncomfortable. Further, it may take some time before price rises to match the good’s value and it gains popularity again.
When considering any investment, consider how you heard about it, whether it’s popular, and how comfortable you feel investing your money in it. If it was through word-of-mouth, the good is popular and you feel entirely comfortable, it may be time to re-examine the value you expect it to provide.
Trish’s Tid-Bits

ALERT: First Home Savings Accounts available November 20th!
We are pleased to advise that First Home Savings Accounts (FHSA) will be available ahead of schedule, starting November 20.
This new registered savings plan gives prospective first-time homebuyers the ability to save on a tax-free basis towards the purchase of a first home in Canada. Like a Registered Retirement Savings Plan (RRSP), contributions to a FHSA will be tax deductible. Withdrawals to purchase a first home will be non-taxable, like a Tax-Free Savings Account (TFSA). There are some interesting planning opportunities with these new accounts, so please reach out to our team if yourself, your child or even your grandchild (age 19 or over) qualifies as a first-time home buyer.
Carry forward amounts do not start accumulating until after the FHSA has been opened so if you plan on taking advantage of these accounts, please contact us right away.
More information on these accounts can be found here.
Gerry’s Guidance: Tax-loss Selling

Tax loss selling, also known as tax-loss harvesting, is a strategy used to minimize capital gains tax liability by selling investments that have experienced losses. This strategy is typically employed near the end of the tax year, as investors review their portfolios and assess their tax situation.
Here’s how the Gold Seal Financial Group implements a tax loss selling strategy:
- Identify Investment Losses:We review our clients’ non-registered investment portfolios to identify assets that have declined in value since they were purchased.
- Sell Investments to Trigger Losses:Following a discussion with our clients, we sell investments we have identified as suitable for this strategy. The sale generates a loss that can offset capital gains we have crystalized throughout the year in other investments.
- Offset Gains:Capital losses can be used to offset capital gains realized in the same tax year or during the three tax years prior. This, in turn, lowers our clients’ overall tax liability. Unused losses may also be carried forward indefinitely so are never lost.
Avoid Superficial Losses: You may decide that you want to continue holding the sold investment as a long-term strategy. If this is the case, you must be careful not to repurchase the security with 30 days of selling it, otherwise, the loss will be considered superficial and cannot be used.
It’s important to note that tax loss selling should not be the sole reason for making investment decisions. It should be part of an overall investment strategy that takes into account your financial goals, risk tolerance, and investment horizon.
We will be reviewing our clients’ portfolios over the coming 6 weeks to identify tax-loss opportunities and will contact you if we identify a meaningful opportunity to take advantage of this strategy. In the meantime, if you have experienced capital gains or losses in 2023 outside of your portfolio with Wellington-Altus, please let us know so that we can factor this information into our overall strategy.
Noteworthy Links
- Canada’s Macklem Sees Clear Signs Rates Are Cooling Economy
- Canadian students are putting their financial and identity security at risk
- Bank of Canada likely to begin cutting rates in mid-2024: CIBC’s Tal
- More than half of Canadian households just $200 from not paying bills
- FIRST READING: Canada’s no-great economy takes a turn for the worse
- How changes to CPP affect your wallet today and tomorrow
- New multigenerational home renovation tax credit may be a hidden gem
Picture of the Month