
Canadian house prices are down 30% in real terms. The banks haven’t noticed. Neither has anyone else.
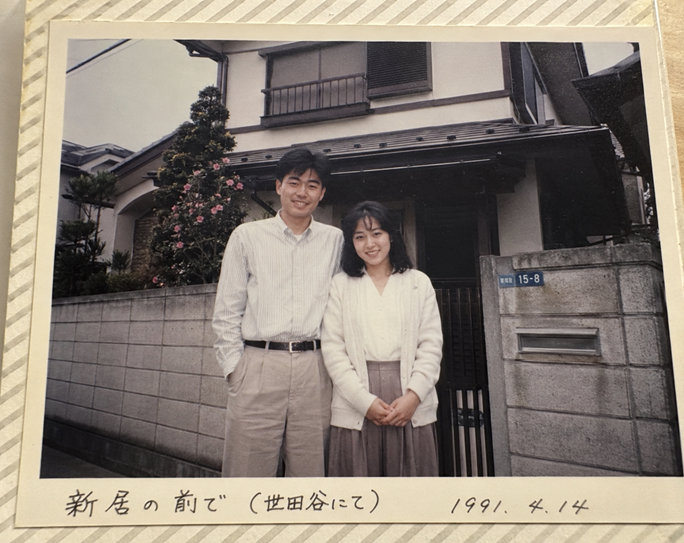
Hiroshi and Yuki (fictional characters as imagined by ChatGPT)
The Japanese Housing Bubble and the Cost of Concentration
Meet Hiroshi and Yuki. In 1991, they took the plunge and bought a modest home in Setagaya, a comfortable suburb on the western edge of Tokyo. They stretched to afford it just like everyone else. Land prices had tripled in a decade and the common knowledge held that Japanese real estate only moved in one direction. Their parents helped with the down payment. Their friends were doing the same thing in the same neighbourhoods. To question it would have been faintly embarrassing, like questioning the weather.
Here’s a picture of them after selling that same house in 2026. Notice they aren’t smiling.
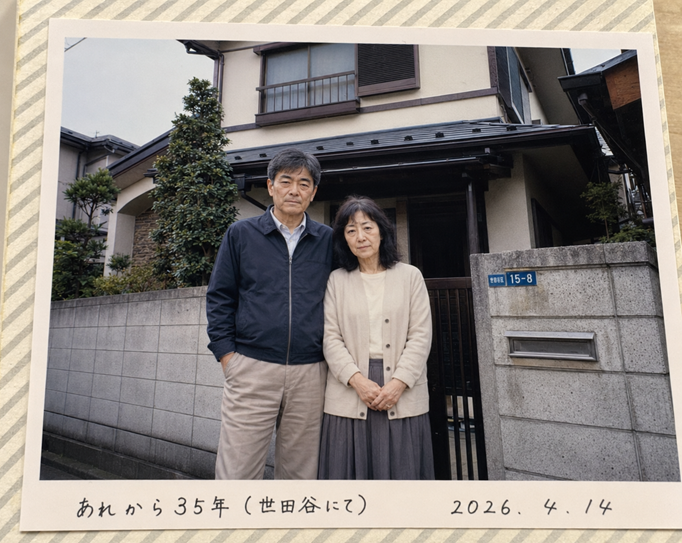
Hiroshi and Yuki (fictional characters as imagined by ChatGPT)
After thirty-five years, commissions, and taxes, they walked away with roughly what they paid in 1991—nominal breakeven. After adjusting for thirty-five years of inflation, they had lost more than half their money. To achieve this result, they paid a mortgage, property taxes, and maintenance for three and a half decades. No wonder they’re not smiling.
Their friends Kenji and Akiko did something different in 1991. They rented a smaller place in the same neighbourhood and put the equivalent of a down payment into a low-cost American index fund. They added to it modestly each year. By 2026, that account was worth roughly fifteen times what they had put in.
Kenji and Akiko were not smarter. They were not braver. They were simply not concentrated in one asset in one country at exactly the wrong moment. They’re still smiling.
What Canadian Housing Prices Are Telling Investors
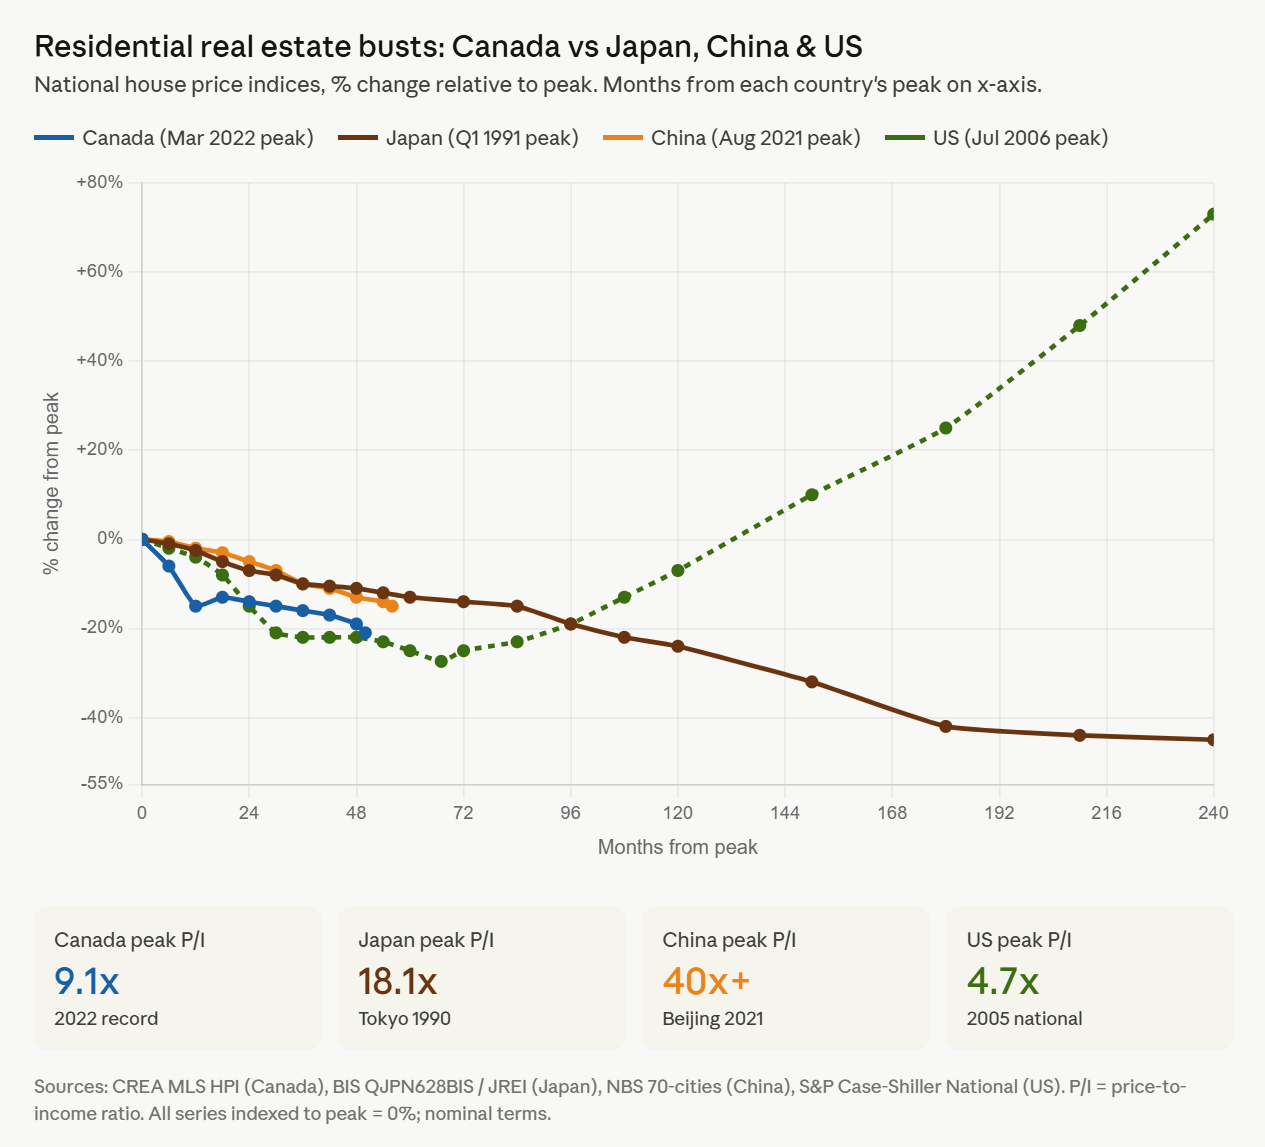
Canadian house prices peaked in March 2022. Fifty months later, the CREA national benchmark is down 21% in nominal terms and roughly 30% in real terms. Toronto is down 26%. Hamilton, 26%. The pain is real, broad, and strangely rarely discussed. It may be the most polite real-estate crash in history. And if history is a guide, it isn’t over yet.
Why Canada’s Housing Correction May Not Be Over
The chart tells the tale. Canada (blue line) is tracking Japan (brown), more so than the the United States (green). The American bubble peaked at 4.7 times median household income; the Canadian bubble peaked at 9.1 times, nearly double. The U.S. correction was sharp, fast, and finished in about six years. The Japanese correction lasted fifteen years and took prices down 40% before stabilizing. We are presently four years into ours. If history rhymes, the reset still has further to run. China too appears to be following the Japanese precedent.
Why Canadian Bank Stocks Haven’t Reacted Yet
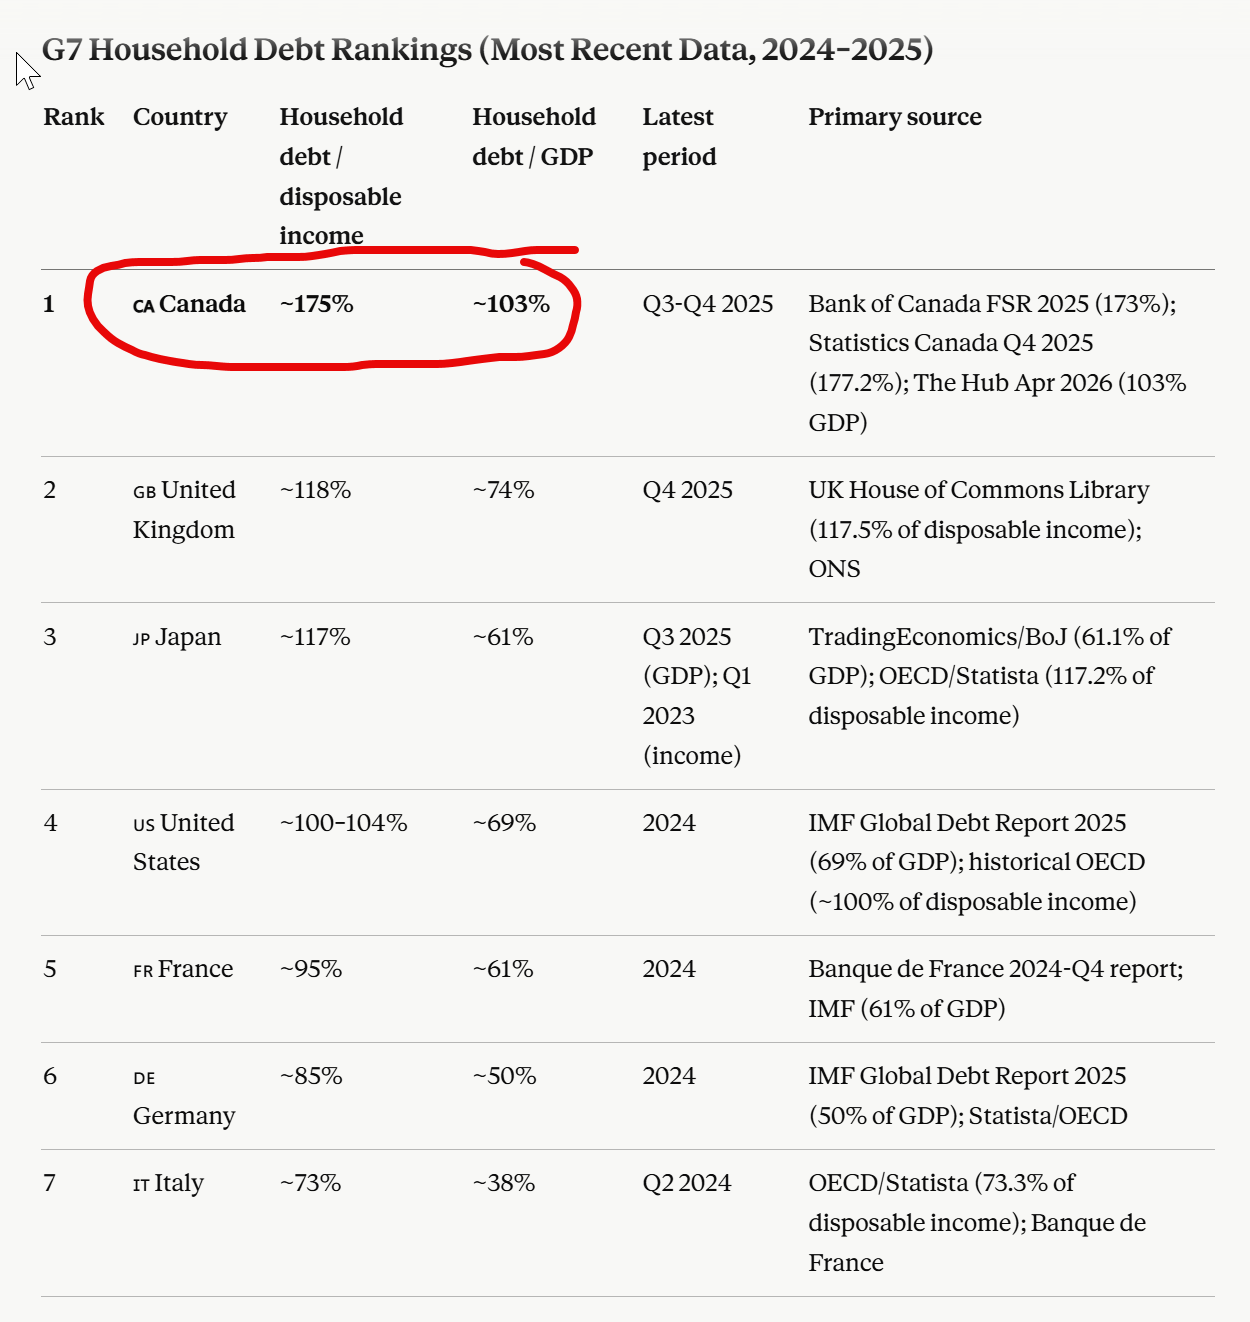
Here is where things get genuinely strange. Canadian households carry more debt relative to income than any other G7 country (167%). Their principal asset is down nearly a third in real terms. Unemployment is over 7%. And the Big Six banks are printing all-time highs, with Royal Bank trading at 2.6 times book value, a richer multiple than JPMorgan, the best-run bank in the world’s deepest capital market.
There is a Canadian taboo about questioning real estate and the Big Six. They are, in a quiet way, as Canadian as the Rocky and Bullwinkle. To suggest that either might be vulnerable is to risk being mistaken for unpatriotic—or forgive me, Loonie. So almost no one asks the obvious question: how can the asset be falling while the lenders are setting records?
How Mortgage Risk is Being Absorbed
The polite answer is that the losses are flowing somewhere else. About 60% of the mortgage book is insured by CMHC, which is to say by the federal taxpayer. Banks are permitted to recognize losses on the expected portion of bad loans, which keeps reported provisions tiny as long as house prices don’t fall further and arrears stay below 0.4%. The visible pain is showing up at alternative lenders, where Mortgage Investment Corporation arrears are now eight times higher than at the Big Six. Borrowers themselves absorb the rest by extending amortizations and drawing down savings.
What History Says About Housing and Bank Stocks
The historical tell is worth knowing. American bank stocks peaked in February 2007—seven months after U.S. housing had already topped. The Dow hit 14,000 in July 2007, a full year after the bust began. Japanese banks looked perfectly fine until 1997, six years past the property peak. Both eventually paid the bill. Neither moved in lock-step with real estate, the pain was delayed for bank shareholders.
Nobody serious is calling for a Canadian banking crisis. The architecture is genuinely better than 1990 (capital buffers are higher, CMHC is bigger, and the Big Six have meaningful U.S. and international earnings). Here’s the problem, the TSX is 33% financials. The banks don’t have to crash to hurt Canadian investors.
The Concentration Risk Facing Canadian Investors
If Canadian banks merely underperform for several years, as real estate bottoms, the index has nowhere obvious to hide. For Canadians whose home is their largest asset, whose RRSP is their next-largest asset, and whose RRSP is heavily Canadian, this is the very definition of concentration risk.
I find it remarkable how the real estate bubble globe-trotted throughout the last 35 years. First Japan, then the U.S. and Europe, then China and now Canada. Many Canadian couples likely have photos like Hiroshi and Yuki, proud owners standing outside their first home. Briana and I hope the bottom will come sooner in Canada than it did in Japan—but we continue to encourage clients to diversify their investments—even if we’re breaking the taboo to do it.
Glen