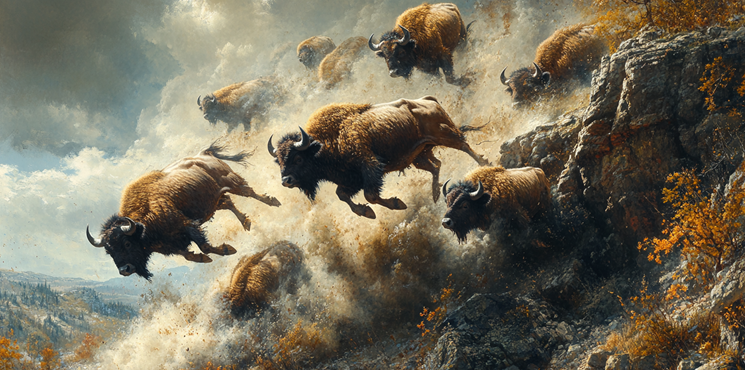
Stampede (Midjourney)
The Stampede Effect: How Fear Leads to Financial Panic
Gunshots shattered the quiet, transforming the American bison herd into a blind stampede of terror. Driven by primal fear, they charged toward a hidden ravine, plunging over its edge to be crushed by their panicked kin. During his 1540 expedition, Spanish explorer Francisco Vázquez de Coronado documented the horrific aftermath, so many bison had fallen that their bodies filled the ravine, creating a bridge of bodies over which the final survivors escaped—a grim testament to panic’s deadly power.
Market Capitulation: The Investor’s Stampede
Like the circle of life, capitulation is both the end and the beginning for investors. Capitulation marks the point where panicked investors, stampeding like wildebeests in the plains of Africa get trampled. Focused on fear, rather than fundamentals, panicked investors sell at any price. Capitulation also marks the bottom when calm investors step in, upgrading portfolios and realizing the essential truth—there is no gain without pain.

The Essential Investment Truth (Midjourney)
Why Volatility Creates Opportunity for Investors
On February 20, the S&P 500 set a new all-time high. Then President Donald Trump, an elicitor of chaos ramped up the trade war rhetoric and investors reversed course. Just three weeks later, fanned on by unrelentingly negative news, the U.S. stock market has fallen 10% with investors now trampling one another for the exits.
Why Market Panic is Good News for Smart Investors
Ironically, this is good news for those of us who remain calm. The sooner weak hands capitulate, the sooner the next uptrend can start. Our task as investors is to remember that we generate higher long term returns not despite this volatility but because of it. Let me repeat that—we generate higher long term returns not despite this volatility but because of it. Without this pain, there is no gain. I created this table earlier this week to illustrate the point.
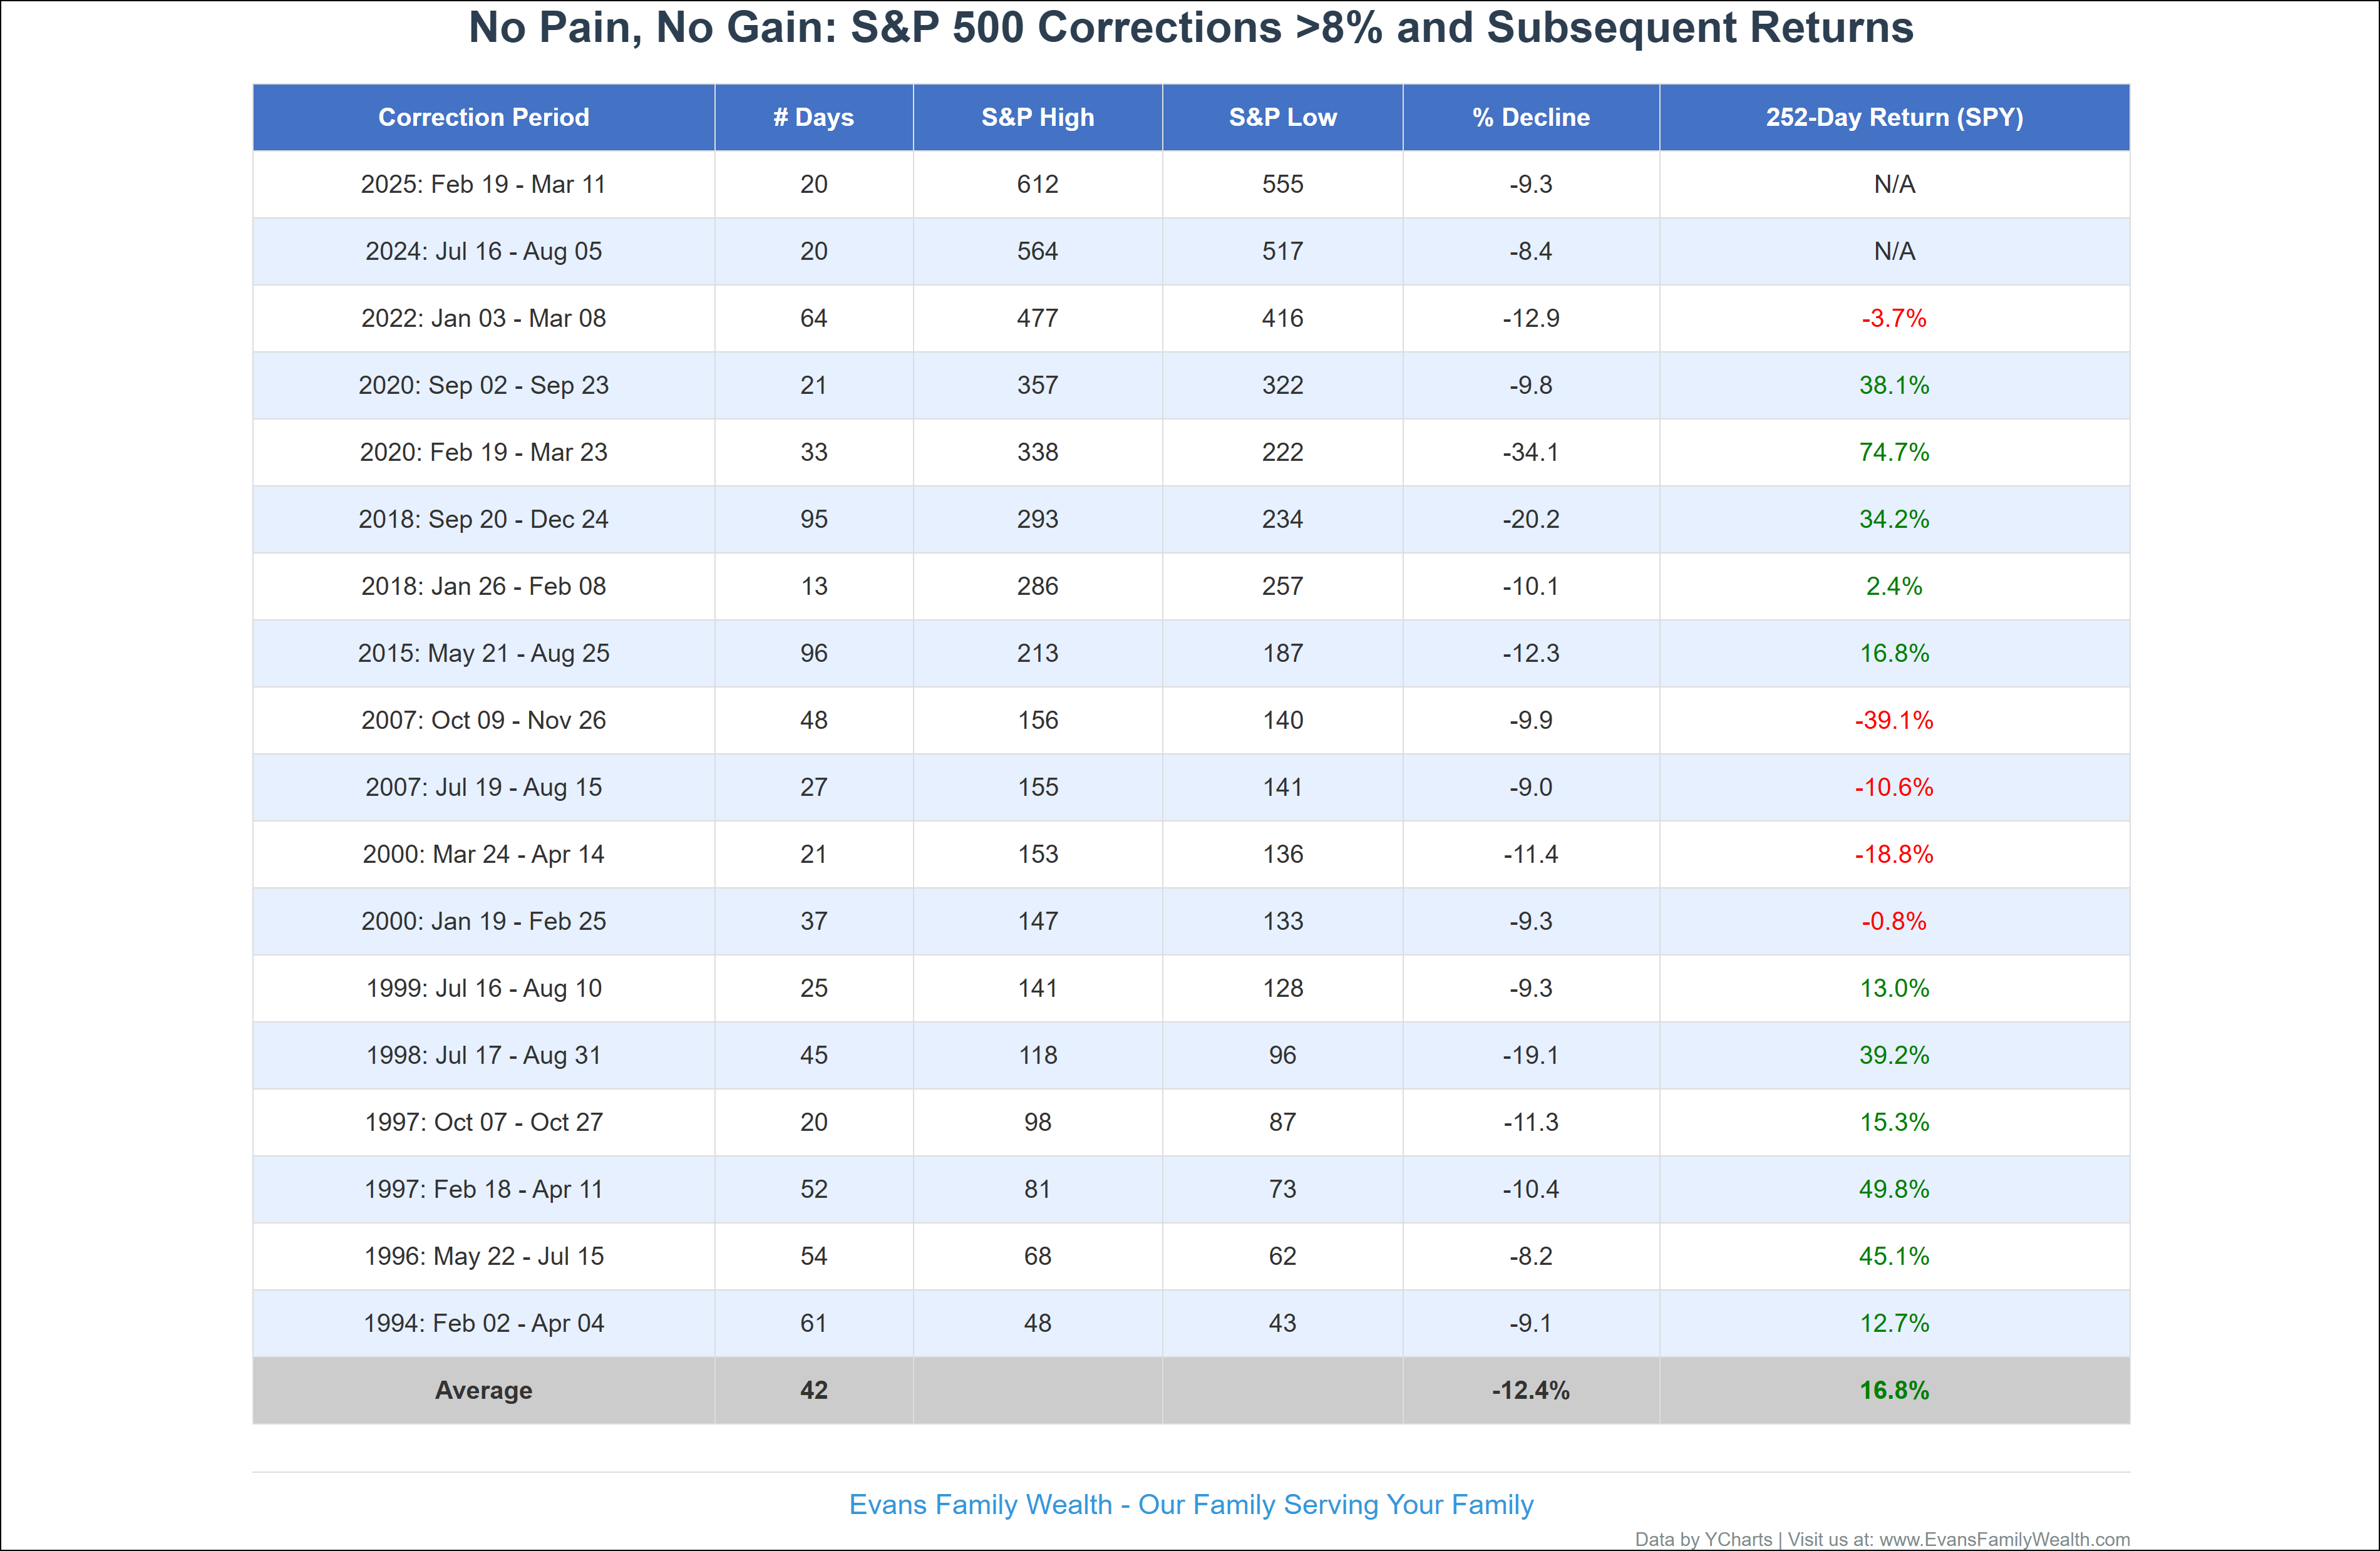
What Happens After a Market Correction?
Since corrections are inevitable, it makes more sense to consider what follows them—on average after declines of 8% or more the S&P 500 advances 16.8% in the following year.
Investor Sentiment: A Key Indicator of Market Recovery
Sentiment indicators are also bouncing off nearly all-time lows. Two that I follow (the Economic Policy Uncertainty Index and the AAII Bear Survey) have reached extreme readings not seen since the Pandemic and the Great Recession.
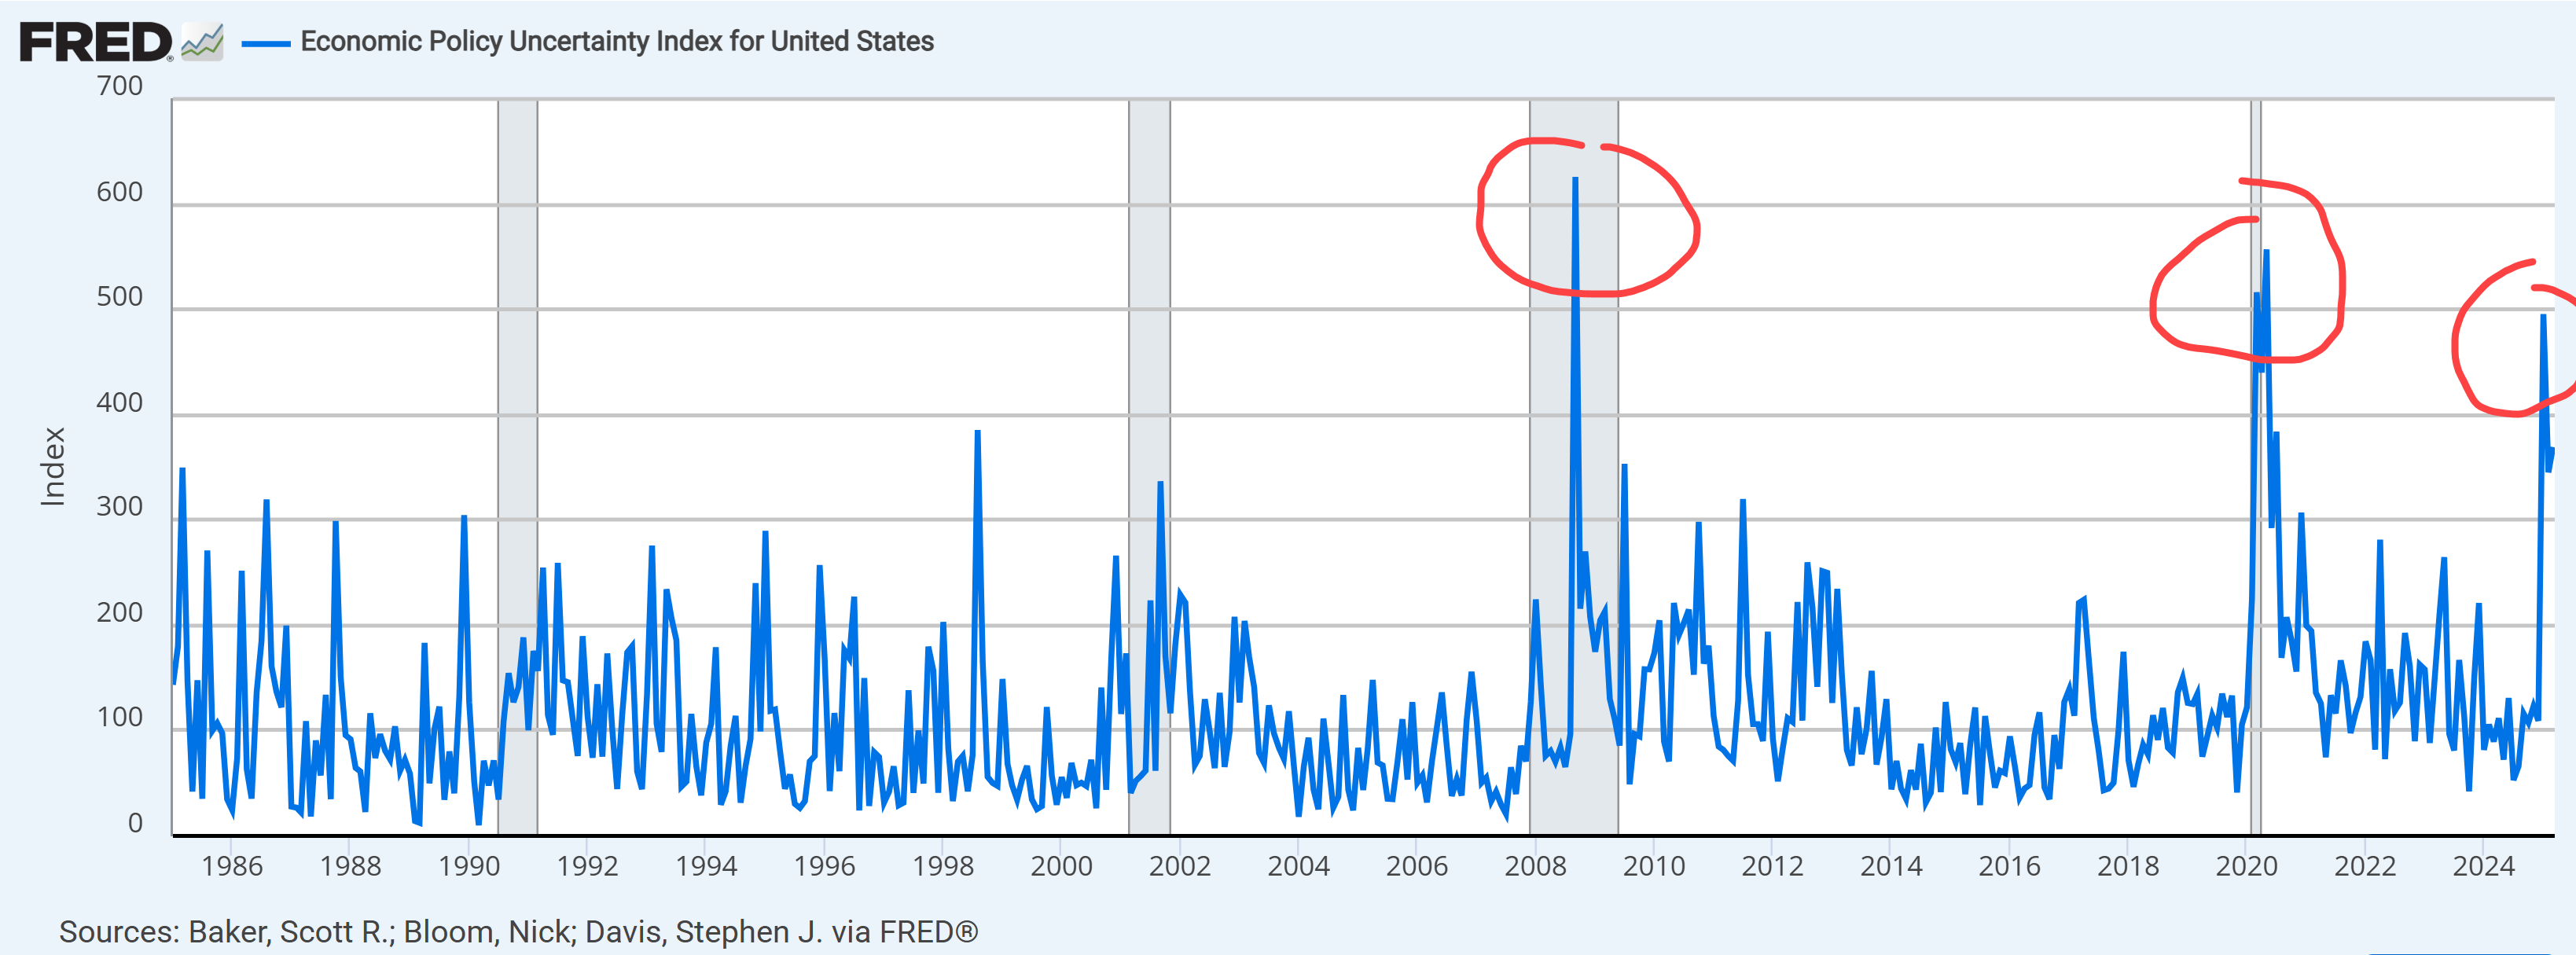
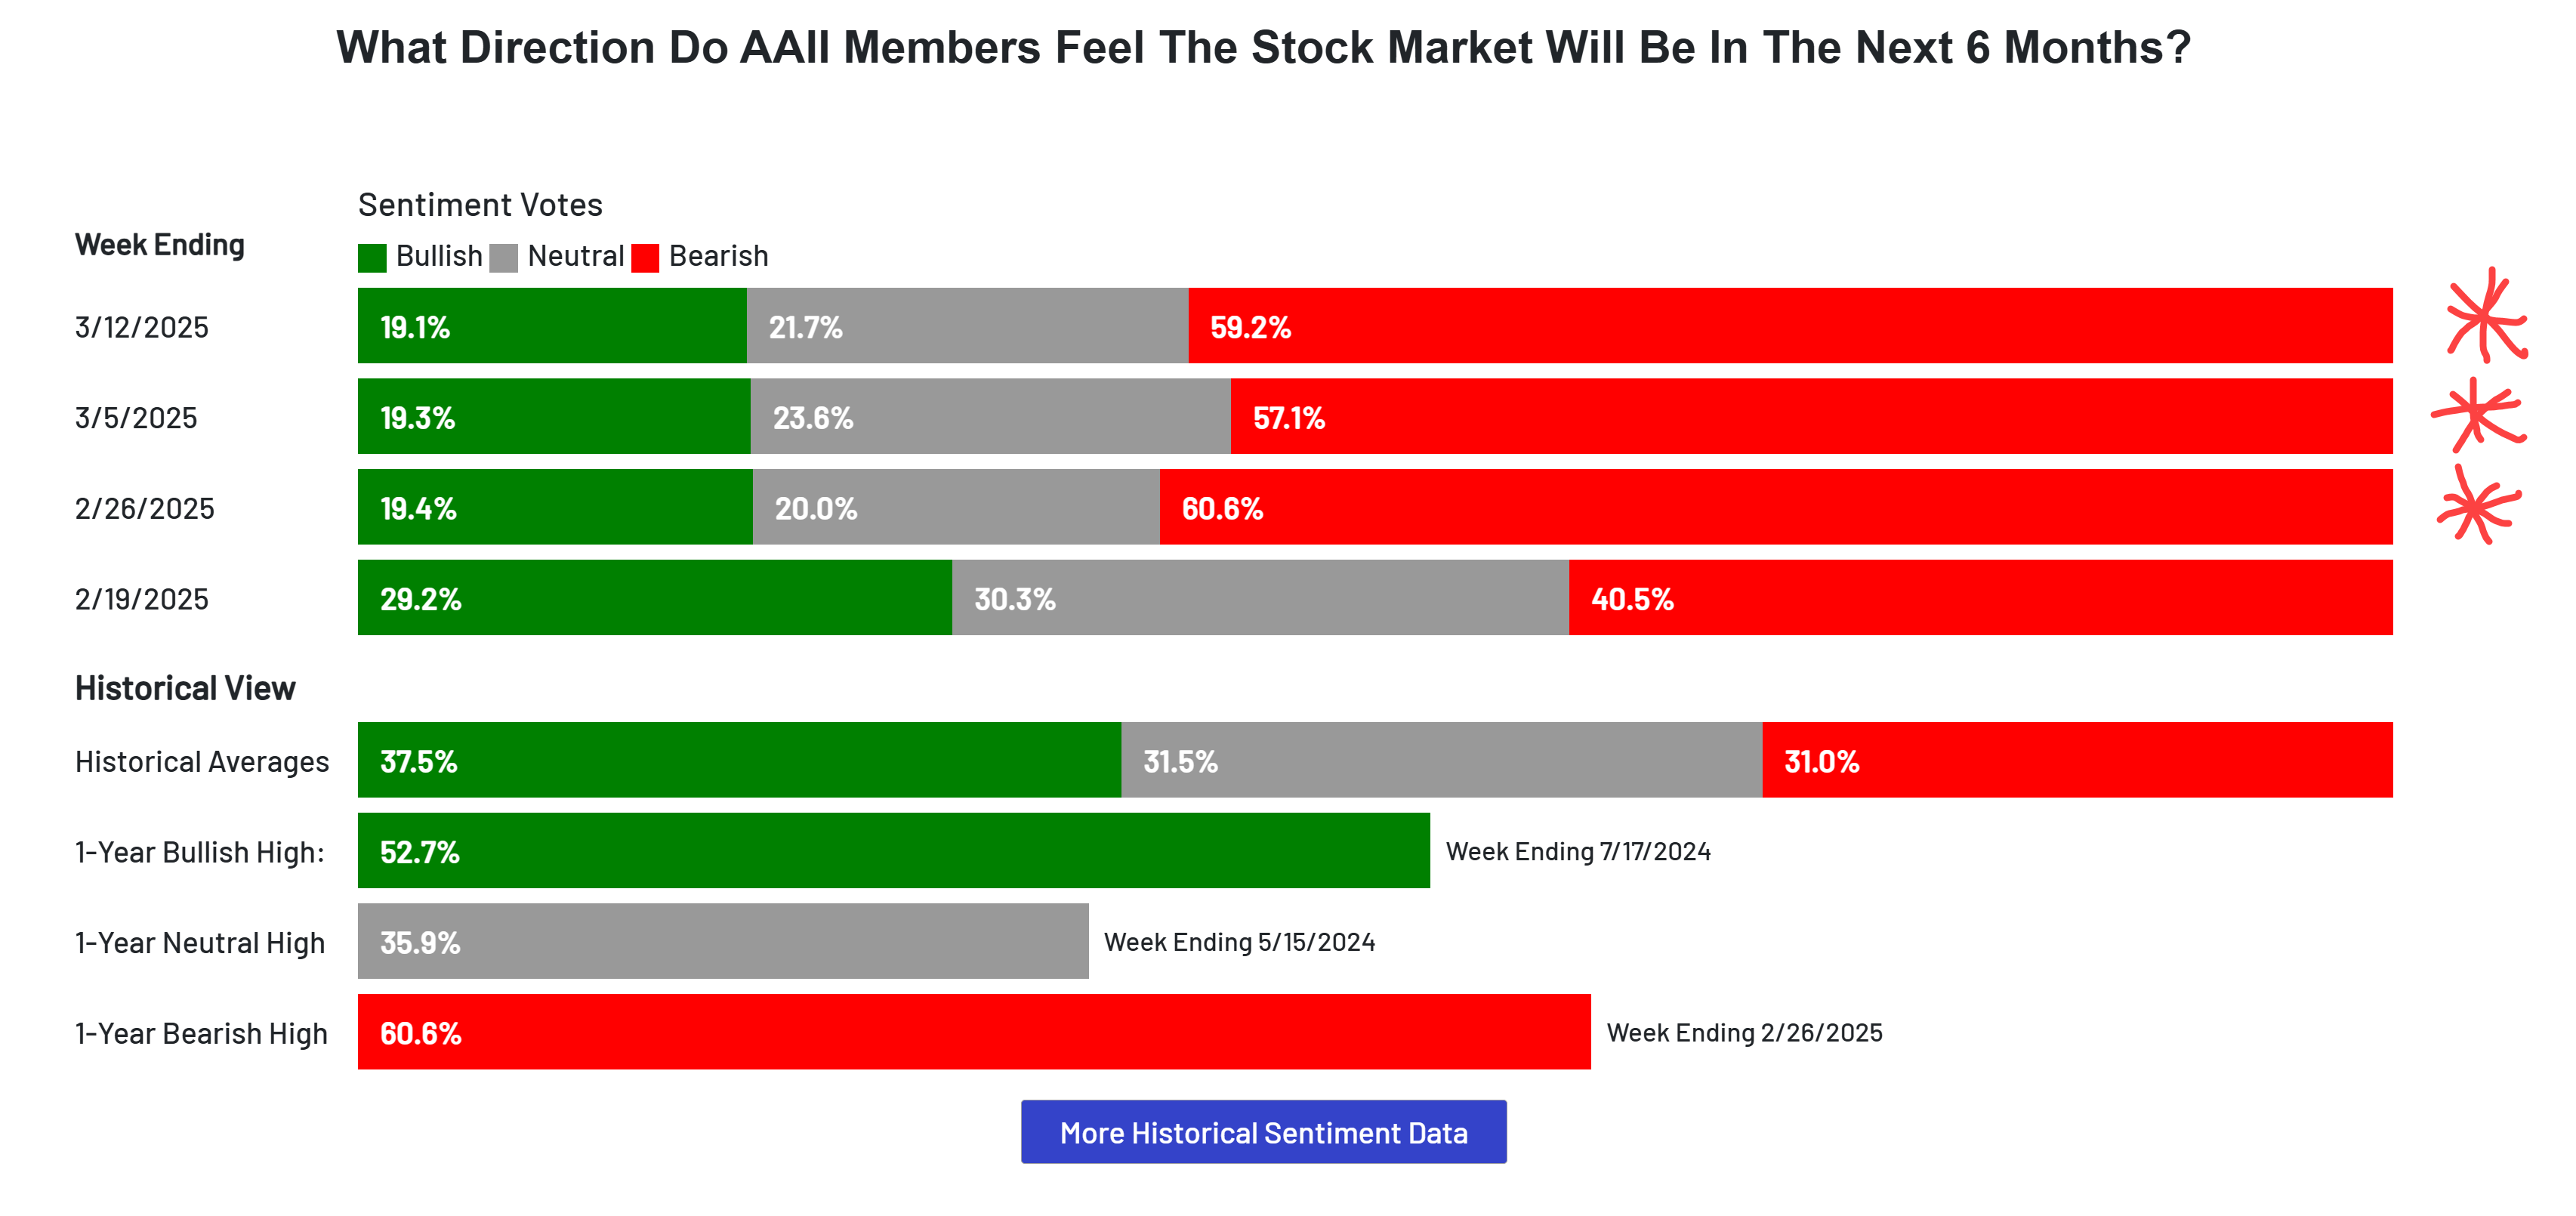
Historical Market Rebounds After Extreme Sentiment Readings
The average one year ahead returns based on those low readings—between 19.4% and 22%. Nobody enjoys the uncertainty and volatility that we are experiencing. It’s tempting to allow ourselves to be carried away by the panic. But we’re not buffalo—the best investors have trained themselves to do the exact opposite of stampeding.
How to Invest During Market Fear
When engaged by the enemy, special forces operators are trained to run towards the attackers rather than away. This minimizes the amount of time they are in contact and turns the tables. Investors too, need to run toward contact (or at least avoid the stampede).
Why Investors Should Buy When Stocks Are on Sale
Investing is the one area of life where consumers prefer not to shop when prices are reduced—currently stocks are on sale. I can’t predict the future, but history suggests the right decision now is to buy not to sell.
Remember no pain, no gain.
Watch the Video: Investment Lessons from the Stampede
Want to hear Glen’s take in more detail? Check out our latest video on YouTube and subscribe to stay up to date.
Glen