A Bifurcation in Sentiment
Download the full PDF here.
Markets rarely linger in equilibrium. The pendulum of sentiment swings between fear and greed, and this year has been no exception. After April’s lows, the S&P surged over 30 percent in just two months, one of the fastest rallies in recent history, while the TSX hit multiple all-time highs.
Yet, the mood among investors remained divided. The summer enthusiasm saw a return of speculative fervour: meme stocks and cryptocurrencies (consider that Fartcoin reached a market cap of $1 billion). Many younger investors, who came of age during the low-rate post-pandemic era (and notably have never experienced a prolonged bear market), leaned into the euphoria. More seasoned investors, meanwhile, appeared to be climbing the proverbial “wall of worry,” mindful of cycles past.
One driver has been the substantial optimism over artificial intelligence (AI). In the first half of 2025, AI capital expenditures contributed more to U.S. GDP growth than consumer spending.1 This has prompted some analysts to ask: Would the U.S. economy have contracted without this massive spend? The top four tech firms alone are on track to spend $344 billion in AI capex this year—about one percent of total U.S. GDP.2
Indeed, the excitement pushed valuations to elevated levels. By summer’s end, the S&P 500 traded at 22.0x forward earnings; well above its long-term average of 16.7x, with the top 10 stocks at 28.8x.3 The S&P/TSX sat lower at 17.0x, reflecting Canada’s heavier weighting in value- oriented sectors like energy and financials.
Are we approaching bubble territory? At the height of the dot-com boom, the S&P 500 had a forward P/E of 24.2x, but many stocks traded much higher: Cisco at 200x and Microsoft at 73x! In the late 1990s, simply adding “.com” to a company’s name could send valuations soaring. Today’s tech leaders are different: profitable, diversified, generating substantial cash flow and leaders in innovation. During the bubble of the “Nifty Fifty” era in the 1960s and 1970s, Polaroid traded at 90x earnings, yet investors still justified such multiples for “one- decision” stocks—buy and never sell.4
While momentum can carry further than many anticipate, fundamentals eventually reassert themselves. Earnings growth and return on capital, among others, drive long- term performance, even when short-term dislocations occur. Elevated valuations can reduce upside potential if prices already reflect
optimistic outcomes, and amplify downside risk should expectations falter. The price you pay remains important to achieving strong long- term outcomes. Valuations may not forecast short-term movements, but they remain a dependable compass, helping investors steer between the twin forces of fear and greed.
As the cooler days approach, it is a reminder that the end of the year will be here before we know it. If you need assistance with any investing matters in these final months of 2025 (see pg. 3, in brief), please call. This Thanksgiving season and beyond, we remain grateful for your trust and wish you a wonderful fall.
- https://fortune.com/2025/08/06/data-center-artificial-intelligence-bubble-consumer-spending-economy/
- https://financialpost.com/news/big-techs-big-bet-ai-driving-spending
- At 6/30/25. https://am.jpmorgan.com/content/dam/ jpm-am-aem/global/en/insights/market-insights/ guide-to-the-markets/mi-guide-to-the-markets-us.pdf
- Nifty Fifty: A group of 50 NYSE large-cap https:// awealthofcommonsense.com/2020/07/the-nifty-fifty- and-the-old-normal/
- https://www.axios.com/2023/10/18/percentage- americans-own-stock-market-investing
WEALTH PERSPECTIVES
Food For Thought: We’ve Never Been Wealthier
Canadians are wealthier than ever. The latest statistics show that average household net worth reached $1.03 million last year and continued to rise. Total wealth has grown by 30 percent since 2019, with Millennial and Gen X wealth climbing by over 10 percent in 2024.1
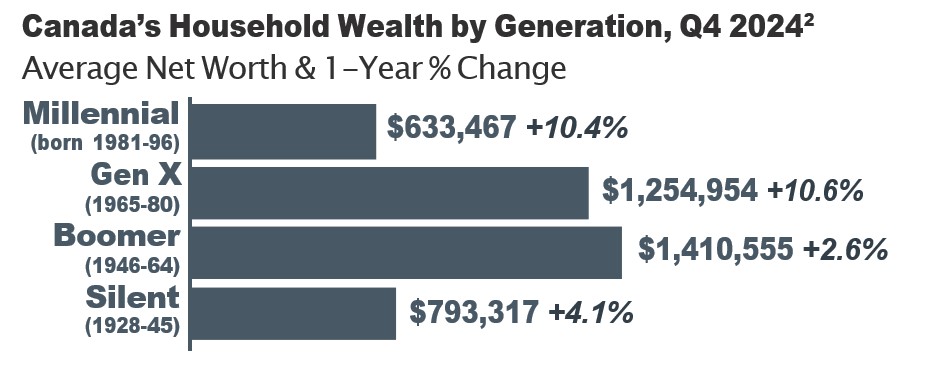
Despite facing one of the toughest job markets in decades and a difficult path to homeownership, Gen Z (born 1997 to 2012) is doing just fine. At the same age, Gen Z incomes are 50 percent higher than Boomers’, according to The Economist. By comparison, Gen X incomes were only 16 percent higher than Boomers’ at the same age—the smallest gain of any group, likely due to a weak labour market after the Global Financial Crisis.2 Gen Z is also saving better, contributing a greater share to retirement plans than Millennials did when entering the workforce. In 2023, the median RRSP contribution for those under 25 was more than 20 percent higher than Millennials in 2009.3
Yet, despite rising wealth across every generation, many don’t feel wealthy. Higher living costs have strained households, while constant connectivity makes it easy for some to feel like they’re falling behind the Joneses. Wealth can be a slippery benchmark—it often feels like it’s never quite enough. Research shows that people quickly adapt.
While incremental increases provide a temporary boost in satisfaction, expectations quickly reset. In one survey, 19 percent of people with a net worth of at least US$500,000 said that ‘having enough money’ was a constant worry. Yet, among those with a net worth of at least US$10 million, 33 percent felt the same.4
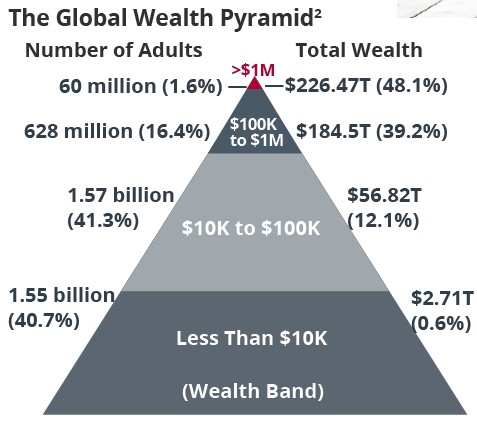
At the end of the day, however, it’s worth remembering: being a millionaire (in USD) puts you in the top 1.6 percent of the wealth pyramid globally.5
1. https://financialpost. com/wealth/canadian-households-worth-more-million-2024
2. https://www. economist.com/finance-and-economics/2024/04/16/generation-z-is-unprecedentedly-rich
3. https://www.theglobeandmail.com/investing/personal-finance/retirement/article-retirement-savings-gen-z-canadians/
4. “Your Money & Your Brain,” Jason Zweig, pg. 127
5. Based on USD. https://www.ubs.com/global/en/wealthmanagement/insights/global-wealth-report.html
ARTIFICIAL INTELLIGENCE EXUBERANCE: HOW FAR WE’VE COME
At a Glance: Perspectives on the Big Tech Bull Market
After a summer of considerable market enthusiasm surrounding artificial intelligence (AI), it’s worth taking a step back.
Why does AI seem to be advancing so quickly? While it may feel like a recent phenomenon, its roots stretch back to the 1950s when Alan Turing proposed his now-famous “Turing Test” for machine intelligence. What’s different today is the pace of progress, driven by exponential increases in computing power, vast datasets and advances in machine learning algorithms. To put it into perspective, in the late 1980s, annual data creation was measured in terabytes (TB). In 2025, global data generation is expected to exceed 180 zettabytes (ZB)—one ZB is a billion times larger than one TB. At the end of the 1980s, one terabyte of storage cost more than $20 million; today, it is well under $100—a mind-blowing decline in just four decades.1
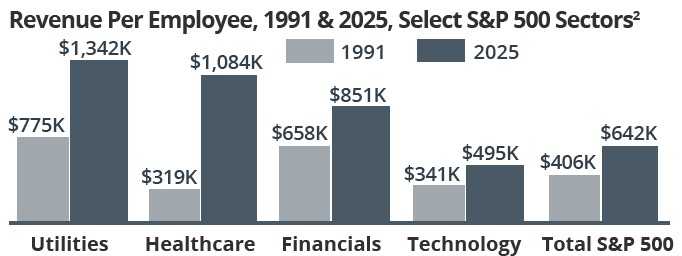
Few doubt that AI will be an economic driver in the years ahead. Technology has long supported productivity gains. Consider how revenue per employee has dramatically increased since 1991
(chart, top), fuelled by computers, the internet, mobile devices, software and the innovation they’ve enabled. However, key questions remain: Will AI live up to its transformative promise, reshaping the world like the steam engine or lightbulb? And, beyond the excitement, who will emerge as the winners?
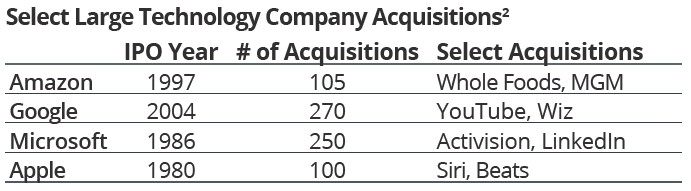
Concerns persist about the concentration of big tech in the S&P 500, but the reality is more nuanced. Today’s largest tech firms differ from the internet darlings of the late 1990s. The “Magnificent Seven” are cash-generating, innovative and diversified, having acquired over 800 companies and expanding across industries. In many ways, they function as modern tech conglomerates—still growing organically, but supported by multiple engines of innovation.
Ultimately, history reminds us that the successful adoption of any new technology doesn’t guarantee financial success for all early adopters. Thoughtful analysis and evaluation, alongside a diversified approach to balance exposure and keep portfolios resilient as conditions shift, can help investors capture innovation’s upside.
1. https://ourworldindata.org/grapher/historical-cost-of-computer-memory-and-storage
2. Inflation-adjusted; https://ritholtz.com/2025/08/the-magnificent-493/
A 547% INCREASE?
On the Rising Cost of Education
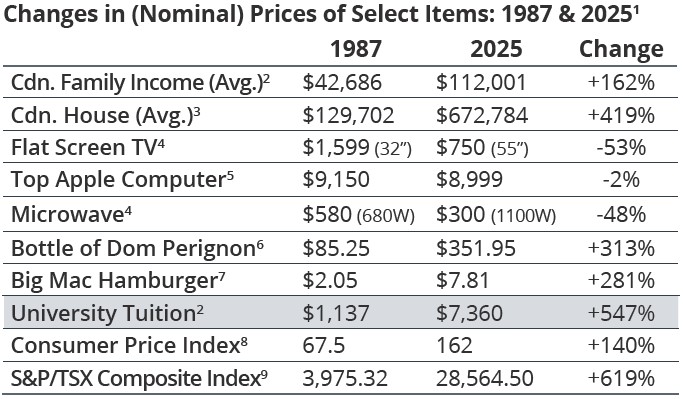
If you’ve eaten fast food recently, you may be surprised by the bill. Thirty years ago, a Big Mac hamburger cost around $2. Today, it is almost four times the price. Over the same period, average family income has risen by 162 percent, while the Consumer Price Index (CPI), the official measure of inflation, increased by 140 percent. Yet, among the items compared below (chart), one cost has far outpaced everything else: university tuition.
With the school year now underway, it is a timely reminder to consider education funding. Ensuring our families have the financial means to support higher education is more important than ever, given the rising costs. An investment program is also a great way for parents, grandparents and other family members to leave a legacy.
1. 1987 data is nominal data from: Report on Business Magazine, Apr. 2012, pg. 13;
2.https://publications.gc.ca/collections/collection_2018/statcan/13-208/CS13-208-1987.
pdf; Stat Can T-1110019101 for 2025, with 3.6% (2024) & 3.8% (2025) wage growth
assumptions;
3. Data from CREA; April 1987 and July 2025 data;
4. Average Sony HDTV price based on 32” and 55”, bestbuy.ca;
5. MacPro Tower, apple.ca;
6. LCBO Ontario pricing at July 1987 and July 2025;
7. economist.com Big Mac Index raw data: https://github.com/TheEconomist/big-mac-data; 8. https://bankofcanada.ca/rates/related/inflation-calculator/ for June 1987 & 2025;
9. At close on 8/27/87 and 8/29/25.
Registered Education Savings Plan (RESP) — The most common tool, the RESP offers tax-deferred investment growth, Canada Education Savings Grants (CESGs) of up to $7,200 per beneficiary and potential income-splitting when funds are withdrawn and taxed in a beneficiary’s hands.
Formal Trust — Unlike RESPs, there are no contribution limits (RESPs have a $50,000 per beneficiary limit), tax deferral or CESG benefits. However, earnings on trust assets may be taxed in the hands of the trust beneficiary if properly structured so attribution rules do not apply. Be aware that once funds are paid to the beneficiary, they can be used for any purpose, not just education.
Life Insurance — Participating whole life insurance can be structured to accumulate cash value to help cover future education costs. The cash value grows in a tax-advantaged way, and the policy also provides life insurance protection for the beneficiary.
Do You Have a Student in the Family?
If you have a student attending post-secondary school, keeping good records is important to take full advantage of tax benefits. Two tips:
- Tuition Tax Credit — This federal non-refundable credit has been reduced to 14 percent of eligible tuition fees (July 2025), with provincial credits available. After applying the tuition credit to their own taxes, any remaining credit can be transferred to one of the following: spouse/partner, parent or grandparent to a maximum of $5,000 less the amount used by the student. Unused amounts can also be carried forward for use by the student in a future year.
- Moving Expenses — Certain moving costs may be deductible. For example, if a student attends a post-secondary program at least 40 km from home and returns in the summer for a job, these expenses may be deductible for the student on a tax return.
FEEL AS THOUGH YOU’RE PAYING MORE TAX?
In Brief: Tax Planning Before Year-End
Despite rising living costs, the share of income spent on necessities has declined. In 1976, households spent about 43 percent of their income on shelter, food and clothing. Today, this has fallen to around 35 percent. What has risen is the share we pay to taxes. In 2025, the average Canadian family paid 43.1 percent in taxes.1 Put differently, if taxes were paid upfront, the first 158 days’ earnings would go entirely to the government!
This is why tax planning continues to be an important part of wealth planning. As we approach the final months of the year, here are a handful of actions, in brief, that may help improve your tax position in 2025:
Split income. This may include electing to split eligible pension income with a spouse or paying reasonable salaries to family members for services provided to your self-employed business.
Contribute to your RRSP. You still have 60 days after the calendar year end to make contributions for the 2025 tax year, but the earlier you contribute, the greater opportunity for tax-deferred growth.
Consider tax-loss harvesting. Realize capital losses to offset capital gains. Please contact the office well before the end of the year to enact this strategy to allow for sufficient settlement time.
Give charitably. Gifting publicly-traded securities to a registered charity may offer tax benefits, including eliminating the capital gains tax liability on appreciated securities.
Claim the pension income tax credit. If you are 65 years or older and don’t have eligible pension income, consider opening a small RRIF or purchasing an annuity.
Withdraw from the TFSA before year- end. If you plan to 1976 2025 withdraw, consider
doing so before the year-end. Contribution room resets at the start of the calendar year, so withdrawals after December 31, 2025, won’t restore contribution room until January 1, 2027.
Make RESP contributions. While it won’t save tax, you may potentially benefit from the CESGs for 2025.
For more information or ideas, please contact the office.
1. https://www.fraserinstitute.org/commentary/canadian-families-must-work-nearly-half-year-pay-taxes
WARREN BUFFETT IS “LEAVING THE BUILDING”…
Succession Planning — What Is Your Business Worth?
Warren Buffett is leaving the building. After almost six decades at the helm of Berkshire Hathaway, Buffett announced earlier this year that he will step down as CEO at the end of the year. Buffett’s departure doesn’t come as a surprise. He named his successor Greg Abel back in 2021, wisely aware that succession planning, like investing, is often most successful when treated as a long game.
Succession planning takes time. Timelines vary based on complexity, but many experts suggest that it typically takes 3 to 5 years to fully implement a plan, and it may even take up to 10 years for family businesses. Yet, time alone isn’t enough. For many small businesses, one of the more overlooked aspects of preparing for a transition is understanding what the business is actually worth. (Of course, as Buffett prepared for his transition, he had the luxury of knowing Berkshire’s value as a publicly-traded company, which reached a trillion-dollar status last year, 44 years after its IPO in 1980!)
The Importance of Valuation
Why does valuation matter? Even if you are years away from transitioning your business, knowing your company’s value today can set realistic expectations. It’s not uncommon for business owners to overestimate what their company is worth. A valuation exercise can uncover gaps, for reasons including:
- Market value vs. book value — Owners may include goodwill or revenue potential, while buyers may only focus on cash flow (what the business earns today and can repay).
- Industry multiples — Valuation depends on comparable sales. Market conditions, growth prospects and sector trends can lower multiples.
- Dependence on key persons — If the business relies heavily on key individuals who may leave the business once it is sold, such as the owner, buyers may apply a discount.
Understanding valuation not only prevents future surprises, but it can also support strategic decisions around growth, succession and family planning:
- Enhancing Future Value — Identifying value drivers may point to strategic opportunities or operational improvements to boost valuation before a transition.
- Planning a Tax-Efficient Sale — Accessing tax-planning strategies such as the Lifetime Capital Gains Exemption (LCGE) or the new Canada Entrepreneur’s Incentive (CEI) may require years of preparation. Techniques such as an estate freeze or the use of a family trust can also help manage tax implications when passing the business within a family.
- Ensuring Family Fairness — If not all children are involved in the business, valuation supports estate equalization, helping to avoid family disputes. Clear communication can also reinforce that ownership is an earned responsibility, potentially minimizing entitlement and promoting stewardship.
- Optimizing Timing & Financing — Valuation can guide when to sell or transition the business, as well as how to structure buy-sell agreements, financing or staged transfers within a family.
- Supporting Retirement & Estate Planning — After many years of building a business, for many business owners the company often represents most of their wealth. Knowing its value can help project and plan for retirement income after transition, as well as for the estate distribution, ensuring financial longevity and security for you and your family.
Knowing your business’s value today can give you better control of tomorrow. It helps you make informed decisions, safeguard your family’s interests and preserve the legacy you’ve worked hard to build. For guidance that goes beyond wealth management, including broader business planning support, our team of specialists can assist. Please call the office for a deeper discussion.
Have You Planned for Your Business’s Succession?
According to the Canadian Federation for Independent Business (CFIB), over three-quarters of business owners expect to exit their businesses within the next decade, representing a potential transfer of $2 trillion in assets.
Yet, succession planning has taken a back seat:
- Only 9% of owners have a formal succession plan
- 54% cite the absence of a suitable buyer as the top obstacle to succession
- 43% identify challenges with business valuation
- 39% note a significant reliance on the owner for day-to-day operations

Newswire
Quarterly Investment Insights – Fall 2025
A Bifurcation in Sentiment
Download the full PDF here.
Markets rarely linger in equilibrium. The pendulum of sentiment swings between fear and greed, and this year has been no exception. After April’s lows, the S&P surged over 30 percent in just two months, one of the fastest rallies in recent history, while the TSX hit multiple all-time highs.
Yet, the mood among investors remained divided. The summer enthusiasm saw a return of speculative fervour: meme stocks and cryptocurrencies (consider that Fartcoin reached a market cap of $1 billion). Many younger investors, who came of age during the low-rate post-pandemic era (and notably have never experienced a prolonged bear market), leaned into the euphoria. More seasoned investors, meanwhile, appeared to be climbing the proverbial “wall of worry,” mindful of cycles past.
One driver has been the substantial optimism over artificial intelligence (AI). In the first half of 2025, AI capital expenditures contributed more to U.S. GDP growth than consumer spending.1 This has prompted some analysts to ask: Would the U.S. economy have contracted without this massive spend? The top four tech firms alone are on track to spend $344 billion in AI capex this year—about one percent of total U.S. GDP.2
Indeed, the excitement pushed valuations to elevated levels. By summer’s end, the S&P 500 traded at 22.0x forward earnings; well above its long-term average of 16.7x, with the top 10 stocks at 28.8x.3 The S&P/TSX sat lower at 17.0x, reflecting Canada’s heavier weighting in value- oriented sectors like energy and financials.
Are we approaching bubble territory? At the height of the dot-com boom, the S&P 500 had a forward P/E of 24.2x, but many stocks traded much higher: Cisco at 200x and Microsoft at 73x! In the late 1990s, simply adding “.com” to a company’s name could send valuations soaring. Today’s tech leaders are different: profitable, diversified, generating substantial cash flow and leaders in innovation. During the bubble of the “Nifty Fifty” era in the 1960s and 1970s, Polaroid traded at 90x earnings, yet investors still justified such multiples for “one- decision” stocks—buy and never sell.4
While momentum can carry further than many anticipate, fundamentals eventually reassert themselves. Earnings growth and return on capital, among others, drive long- term performance, even when short-term dislocations occur. Elevated valuations can reduce upside potential if prices already reflect
optimistic outcomes, and amplify downside risk should expectations falter. The price you pay remains important to achieving strong long- term outcomes. Valuations may not forecast short-term movements, but they remain a dependable compass, helping investors steer between the twin forces of fear and greed.
As the cooler days approach, it is a reminder that the end of the year will be here before we know it. If you need assistance with any investing matters in these final months of 2025 (see pg. 3, in brief), please call. This Thanksgiving season and beyond, we remain grateful for your trust and wish you a wonderful fall.
WEALTH PERSPECTIVES
Food For Thought: We’ve Never Been Wealthier
Canadians are wealthier than ever. The latest statistics show that average household net worth reached $1.03 million last year and continued to rise. Total wealth has grown by 30 percent since 2019, with Millennial and Gen X wealth climbing by over 10 percent in 2024.1
Despite facing one of the toughest job markets in decades and a difficult path to homeownership, Gen Z (born 1997 to 2012) is doing just fine. At the same age, Gen Z incomes are 50 percent higher than Boomers’, according to The Economist. By comparison, Gen X incomes were only 16 percent higher than Boomers’ at the same age—the smallest gain of any group, likely due to a weak labour market after the Global Financial Crisis.2 Gen Z is also saving better, contributing a greater share to retirement plans than Millennials did when entering the workforce. In 2023, the median RRSP contribution for those under 25 was more than 20 percent higher than Millennials in 2009.3
Yet, despite rising wealth across every generation, many don’t feel wealthy. Higher living costs have strained households, while constant connectivity makes it easy for some to feel like they’re falling behind the Joneses. Wealth can be a slippery benchmark—it often feels like it’s never quite enough. Research shows that people quickly adapt.
While incremental increases provide a temporary boost in satisfaction, expectations quickly reset. In one survey, 19 percent of people with a net worth of at least US$500,000 said that ‘having enough money’ was a constant worry. Yet, among those with a net worth of at least US$10 million, 33 percent felt the same.4
At the end of the day, however, it’s worth remembering: being a millionaire (in USD) puts you in the top 1.6 percent of the wealth pyramid globally.5
1. https://financialpost. com/wealth/canadian-households-worth-more-million-2024
2. https://www. economist.com/finance-and-economics/2024/04/16/generation-z-is-unprecedentedly-rich
3. https://www.theglobeandmail.com/investing/personal-finance/retirement/article-retirement-savings-gen-z-canadians/
4. “Your Money & Your Brain,” Jason Zweig, pg. 127
5. Based on USD. https://www.ubs.com/global/en/wealthmanagement/insights/global-wealth-report.html
ARTIFICIAL INTELLIGENCE EXUBERANCE: HOW FAR WE’VE COME
At a Glance: Perspectives on the Big Tech Bull Market
After a summer of considerable market enthusiasm surrounding artificial intelligence (AI), it’s worth taking a step back.
Why does AI seem to be advancing so quickly? While it may feel like a recent phenomenon, its roots stretch back to the 1950s when Alan Turing proposed his now-famous “Turing Test” for machine intelligence. What’s different today is the pace of progress, driven by exponential increases in computing power, vast datasets and advances in machine learning algorithms. To put it into perspective, in the late 1980s, annual data creation was measured in terabytes (TB). In 2025, global data generation is expected to exceed 180 zettabytes (ZB)—one ZB is a billion times larger than one TB. At the end of the 1980s, one terabyte of storage cost more than $20 million; today, it is well under $100—a mind-blowing decline in just four decades.1
Few doubt that AI will be an economic driver in the years ahead. Technology has long supported productivity gains. Consider how revenue per employee has dramatically increased since 1991
(chart, top), fuelled by computers, the internet, mobile devices, software and the innovation they’ve enabled. However, key questions remain: Will AI live up to its transformative promise, reshaping the world like the steam engine or lightbulb? And, beyond the excitement, who will emerge as the winners?
Concerns persist about the concentration of big tech in the S&P 500, but the reality is more nuanced. Today’s largest tech firms differ from the internet darlings of the late 1990s. The “Magnificent Seven” are cash-generating, innovative and diversified, having acquired over 800 companies and expanding across industries. In many ways, they function as modern tech conglomerates—still growing organically, but supported by multiple engines of innovation.
Ultimately, history reminds us that the successful adoption of any new technology doesn’t guarantee financial success for all early adopters. Thoughtful analysis and evaluation, alongside a diversified approach to balance exposure and keep portfolios resilient as conditions shift, can help investors capture innovation’s upside.
1. https://ourworldindata.org/grapher/historical-cost-of-computer-memory-and-storage
2. Inflation-adjusted; https://ritholtz.com/2025/08/the-magnificent-493/
A 547% INCREASE?
On the Rising Cost of Education
If you’ve eaten fast food recently, you may be surprised by the bill. Thirty years ago, a Big Mac hamburger cost around $2. Today, it is almost four times the price. Over the same period, average family income has risen by 162 percent, while the Consumer Price Index (CPI), the official measure of inflation, increased by 140 percent. Yet, among the items compared below (chart), one cost has far outpaced everything else: university tuition.
With the school year now underway, it is a timely reminder to consider education funding. Ensuring our families have the financial means to support higher education is more important than ever, given the rising costs. An investment program is also a great way for parents, grandparents and other family members to leave a legacy.
1. 1987 data is nominal data from: Report on Business Magazine, Apr. 2012, pg. 13;
2.https://publications.gc.ca/collections/collection_2018/statcan/13-208/CS13-208-1987.
pdf; Stat Can T-1110019101 for 2025, with 3.6% (2024) & 3.8% (2025) wage growth
assumptions;
3. Data from CREA; April 1987 and July 2025 data;
4. Average Sony HDTV price based on 32” and 55”, bestbuy.ca;
5. MacPro Tower, apple.ca;
6. LCBO Ontario pricing at July 1987 and July 2025;
7. economist.com Big Mac Index raw data: https://github.com/TheEconomist/big-mac-data; 8. https://bankofcanada.ca/rates/related/inflation-calculator/ for June 1987 & 2025;
9. At close on 8/27/87 and 8/29/25.
Registered Education Savings Plan (RESP) — The most common tool, the RESP offers tax-deferred investment growth, Canada Education Savings Grants (CESGs) of up to $7,200 per beneficiary and potential income-splitting when funds are withdrawn and taxed in a beneficiary’s hands.
Formal Trust — Unlike RESPs, there are no contribution limits (RESPs have a $50,000 per beneficiary limit), tax deferral or CESG benefits. However, earnings on trust assets may be taxed in the hands of the trust beneficiary if properly structured so attribution rules do not apply. Be aware that once funds are paid to the beneficiary, they can be used for any purpose, not just education.
Life Insurance — Participating whole life insurance can be structured to accumulate cash value to help cover future education costs. The cash value grows in a tax-advantaged way, and the policy also provides life insurance protection for the beneficiary.
Do You Have a Student in the Family?
If you have a student attending post-secondary school, keeping good records is important to take full advantage of tax benefits. Two tips:
FEEL AS THOUGH YOU’RE PAYING MORE TAX?
In Brief: Tax Planning Before Year-End
Despite rising living costs, the share of income spent on necessities has declined. In 1976, households spent about 43 percent of their income on shelter, food and clothing. Today, this has fallen to around 35 percent. What has risen is the share we pay to taxes. In 2025, the average Canadian family paid 43.1 percent in taxes.1 Put differently, if taxes were paid upfront, the first 158 days’ earnings would go entirely to the government!
This is why tax planning continues to be an important part of wealth planning. As we approach the final months of the year, here are a handful of actions, in brief, that may help improve your tax position in 2025:
Split income. This may include electing to split eligible pension income with a spouse or paying reasonable salaries to family members for services provided to your self-employed business.
Contribute to your RRSP. You still have 60 days after the calendar year end to make contributions for the 2025 tax year, but the earlier you contribute, the greater opportunity for tax-deferred growth.
Consider tax-loss harvesting. Realize capital losses to offset capital gains. Please contact the office well before the end of the year to enact this strategy to allow for sufficient settlement time.
Give charitably. Gifting publicly-traded securities to a registered charity may offer tax benefits, including eliminating the capital gains tax liability on appreciated securities.
Claim the pension income tax credit. If you are 65 years or older and don’t have eligible pension income, consider opening a small RRIF or purchasing an annuity.
Withdraw from the TFSA before year- end. If you plan to 1976 2025 withdraw, consider
doing so before the year-end. Contribution room resets at the start of the calendar year, so withdrawals after December 31, 2025, won’t restore contribution room until January 1, 2027.
Make RESP contributions. While it won’t save tax, you may potentially benefit from the CESGs for 2025.
For more information or ideas, please contact the office.
1. https://www.fraserinstitute.org/commentary/canadian-families-must-work-nearly-half-year-pay-taxes
WARREN BUFFETT IS “LEAVING THE BUILDING”…
Succession Planning — What Is Your Business Worth?
Warren Buffett is leaving the building. After almost six decades at the helm of Berkshire Hathaway, Buffett announced earlier this year that he will step down as CEO at the end of the year. Buffett’s departure doesn’t come as a surprise. He named his successor Greg Abel back in 2021, wisely aware that succession planning, like investing, is often most successful when treated as a long game.
Succession planning takes time. Timelines vary based on complexity, but many experts suggest that it typically takes 3 to 5 years to fully implement a plan, and it may even take up to 10 years for family businesses. Yet, time alone isn’t enough. For many small businesses, one of the more overlooked aspects of preparing for a transition is understanding what the business is actually worth. (Of course, as Buffett prepared for his transition, he had the luxury of knowing Berkshire’s value as a publicly-traded company, which reached a trillion-dollar status last year, 44 years after its IPO in 1980!)
The Importance of Valuation
Why does valuation matter? Even if you are years away from transitioning your business, knowing your company’s value today can set realistic expectations. It’s not uncommon for business owners to overestimate what their company is worth. A valuation exercise can uncover gaps, for reasons including:
Understanding valuation not only prevents future surprises, but it can also support strategic decisions around growth, succession and family planning:
Knowing your business’s value today can give you better control of tomorrow. It helps you make informed decisions, safeguard your family’s interests and preserve the legacy you’ve worked hard to build. For guidance that goes beyond wealth management, including broader business planning support, our team of specialists can assist. Please call the office for a deeper discussion.
Have You Planned for Your Business’s Succession?
According to the Canadian Federation for Independent Business (CFIB), over three-quarters of business owners expect to exit their businesses within the next decade, representing a potential transfer of $2 trillion in assets.
Yet, succession planning has taken a back seat:
Recent Posts
March Market Insights: There is no Bronze Medal
The capex surging into AI looks less like froth and more like strategic reconstruction. In his March Market Insights, James Thorne explores how this capex supercycle is reshaping U.S. economic expansion—and why markets may be getting this key aspect of the AI story wrong.
February Market Insights: Fortress America and the Colony Next Door
The Trump Doctrine envisions a sovereign, American-led Western Hemisphere. But where does that leave Canada—and how do we secure our own economic sovereignty? James Thorne shares his thoughts in his February Market Insights.
January Market Insights: The 2026 Market Forecast
A new market cycle is taking shape. In his January Market Insights, James Thorne shares his thoughts on the market outlook for 2026. Investors should lean in – being underallocated could be the biggest risk of all.
Quarterly Investment Insights – Winter 2026
It is the end of an era: after 60 years at the helm, one of the world’s most closely watched investors has stepped down as CEO. Very few people stay in one role for six decades. For context, the median tenure with a single employer dropped to 3.9 years in the U.S., while the average working life spans roughly 37 years.1 This puts into perspective the remarkable length of Warren Buffett’s leadership of Berkshire Hathaway—nearly twice the span of a typical career. Even if you don’t subscribe to Buffett’s investing philosophy, the scale of his accomplishments is clear. After taking control in 1965, he transformed Berkshire from a struggling textile mill into a multi-national conglomerate holding company, growing its share price from about $19 to roughly $745,000—a cumulative gain of nearly 4,000,000 percent! In 2024, Berkshire became the first U.S. non-tech company to surpass a trillion-dollar market capitalization.
December Market Insights: 2026 and the King Dollar Revival
What will define 2026? In his December Market Insights, James Thorne examines the resilience of “King Dollar” in a year that will be defined by structural renewal, disciplined markets, and an unfolding capital expenditures supercycle.
The opinions contained herein are the opinions of the author and readers should not assume they reflect the opinions or recommendations of Wellington-Altus Private Wealth. Assumptions, opinions and information constitute the author’s judgement as of the date this material and subject to change without notice. We do not warrant the completeness or accuracy of this material, and it should not be relied upon as such. Before acting on any recommendation, you should consider whether it is suitable for your particular circumstances and, if necessary, seek professional advice. Graphs and charts are used for illustrative purposes only and do not reflect future values or future performance of any investment. The information does not provide financial, legal, tax or investment advice. Particular investment, tax, or trading strategies should be evaluated relative to each individual’s objectives and risk tolerance. All third party products and services referred to or advertised in this presentation are sold by the company or organization named. While these products or services may serve as valuable aids to the independent investor, WAPW does not specifically endorse any of these products or services. The third party products and services referred to, or advertised in this presentation, are available as a convenience to its customers only, and WAPW is not liable for any claims, losses or damages however arising out of any purchase or use of third party products or services. All insurance products and services are offered by life licensed advisors of Wellington-Altus.