Maili’s Market Insights:
Weathering the Current Storm – Summer update July 2022
Happy Summertime everyone! As we enter the summer months, my team at The Wong Group and I hope you and your family are healthy and well, amidst all that is going on in the world today. We wanted to proactively reach out and share with you our latest insights on:
- – The recent market volatility
- – The stock market
- – The bond market
- – Inflation
- – Recession – are we heading toward a recession?
- – What you can do as an investor
Our clients value our team as a stabilizing force during turbulent times. This value has been more important than ever over the past two years, as the world experienced a global pandemic, and the investment markets underwent some tremendous volatility – causing people to feel vulnerable from both a health and wealth perspective.
Fortunately, our team has been present, focused and prepared to apply our Smart Risk approach to navigating these choppy waters.
Most recently, as the peak of the pandemic news fades from the headlines, other global events have found the spotlight in the news, including:
- 1. Rising Interest Rates in US and Canada
- 2. Inflation and
- 3. Higher interest rates, potentially leading to a Recession
All these issues are giving rise to market swings and renewed volatility over the past six months. But what I hope to discuss today, is why while market volatility can “feel” uncomfortable to the average investor, it’s very normal, and an expected part of investing. I’ll show how we can take advantage of this volatility, on behalf of our clients to seize the opportunities.
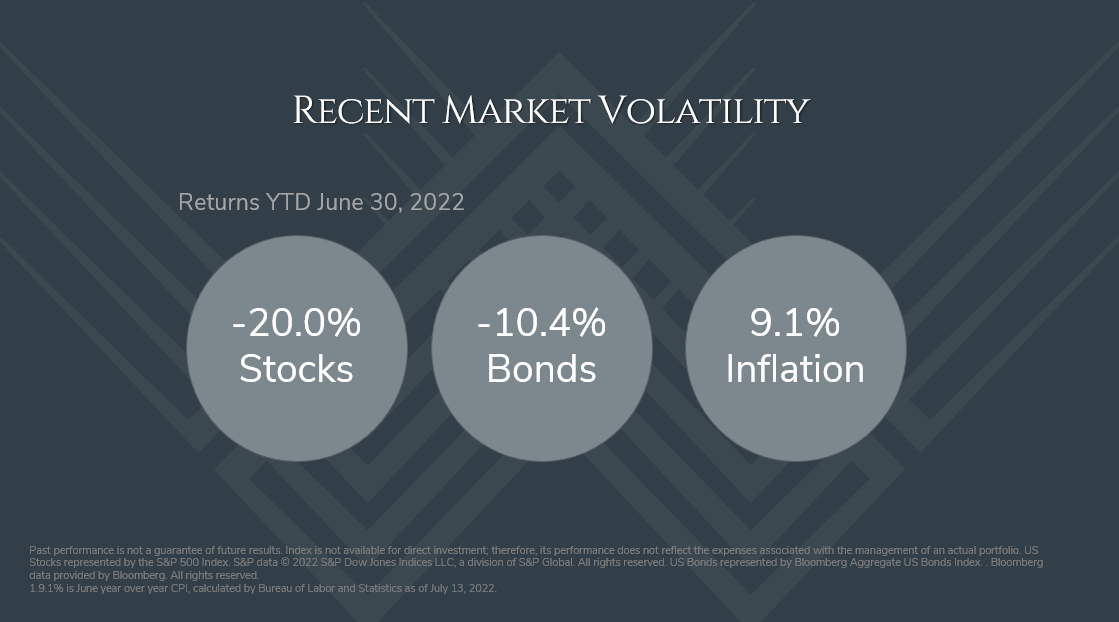
Recent Market Volatility
So, let’s address these key global events and market drivers directly:
Markets have been volatile. From a Global Perspective, the broader markets – both stocks and bonds, have been down significantly this year. Most global equity markets like the S&P500 and Nasdaq indexes have experienced drops of 20% to 30%, respectively, this calendar year. Bonds are down 10% year to date – remember, when interest rates rise, bond prices go down. Why have interest rates been rising? Central banks have been raising interest rates to fight Inflation, which reflects that the general level of prices of goods and services has increased 9.1% from last year.
-
- – In the past 6 months within many of our client portfolios, we have taken a more “defensive” position, and managing risks to tilt portfolios toward “high quality” companies with strong balance sheets, low debt, and steady cash flows that they often distribute as dividends. These dividends can help our clients get “paid to wait” for the markets to recover.
- – We’re also ready to start adding risk back to client portfolios, as sentiment indicators are at all-time lows, and valuations look compelling with good companies trading at 20% to 50% on sale!
- – As a fellow portfolio manager put it, ‘the market is the only store where customers run out screaming when there is a big sale.’
A Rough Start to the Year
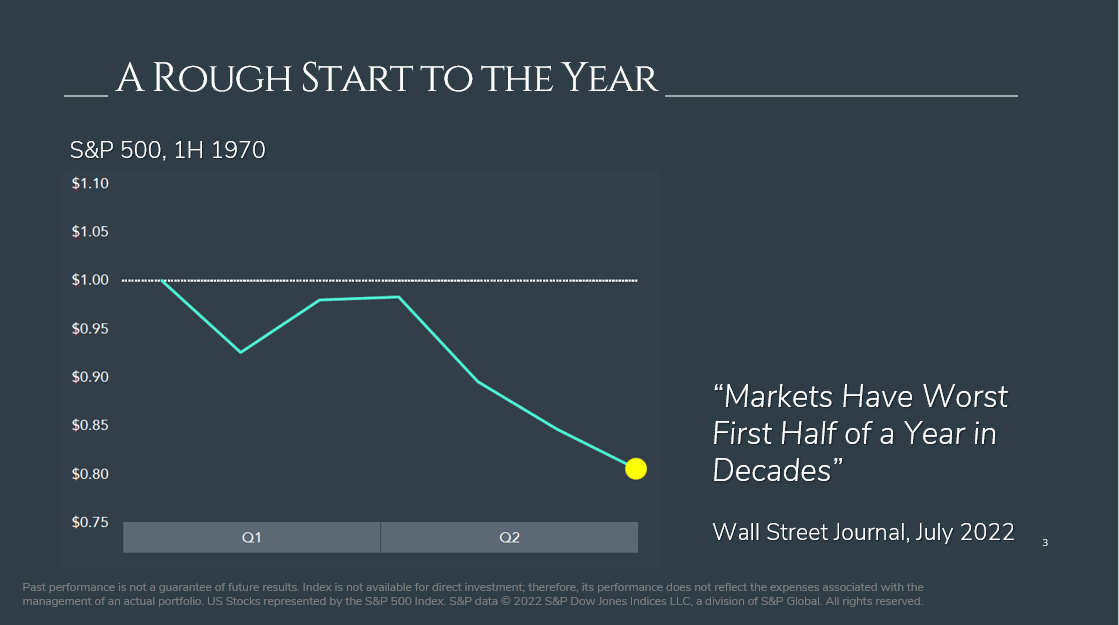
As we know, it’s been a rough start to the year for the global markets, and inflation is back in the headlines. My father Terry Wong says “Hey Mai, it was way worse back in the 70s and 80’s”. Let’s take a look at what happened during 1970s…
The first half of 1970 time period was similarly rough, as the Wall Street Journal put out “Markets have worst first half of the year in decades”… as you can see from this chart, it shows the first half of the year down significantly by about 20% much like today… but you don’t hear the half of the story. The news media outlets play a big part; they love to hype up the numbers.
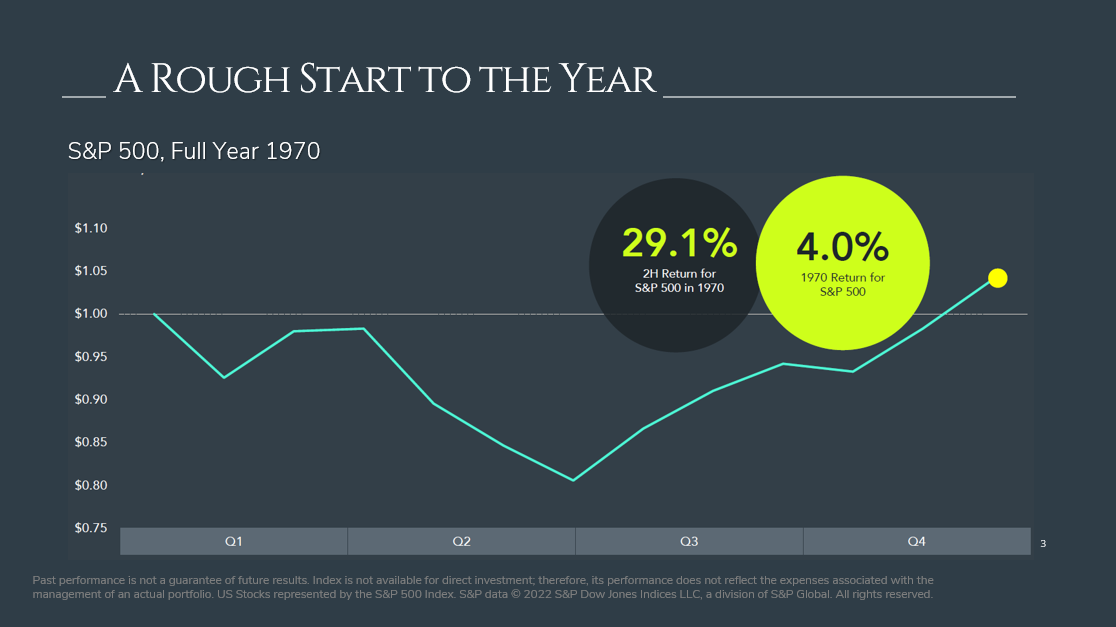
But remember, when you read these stories, you often only get HALF the story, or the part that sells the most newspapers. But in fact, for investors who remained patient, stuck with their investment plan, the back half of the year actually came out strong.
As you can see from this chart, the back half of the year in 1970 reversed, and returned +29% for the S&P500. That year ended up recovering and returned a net positive +4%! Be wary of the doom and gloom headlines you read.
Bottom line: this volatility is not new, and markets will eventually recover.
Let’s talk about Stock markets in more depth.
US Market Intra-Year Gains & Declines VS Calendar Year Returns
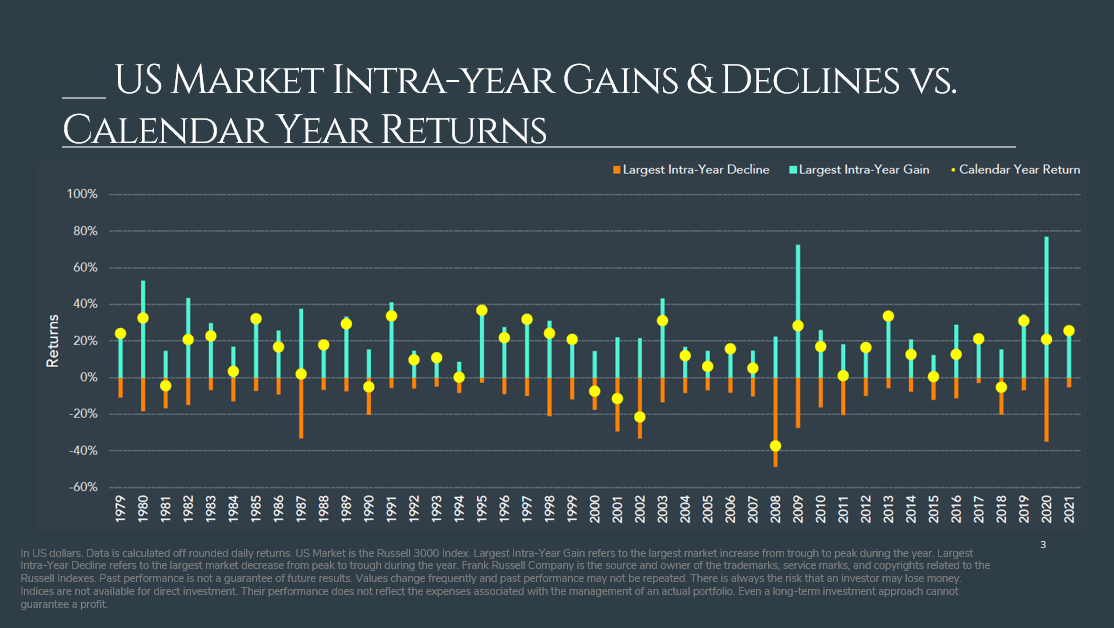
In this chart, you are looking at the US stock market returns each year from 1979 to 2021, with the orange lines showing the year’s Largest Intra-Year Decline; and the blue lines showing the Largest Intra-Year Gain. The yellow dots are showing the total year’s annual returns, which are mostly positive.
In several years, you see orange lines displaying large market drops during the year. But do these drops have any impact on the returns on that year? No, they actually don’t; as you can see with most years having orange draw downs, the Yellow Circles representing the calendar year returns still end up in positive territory for the year.
So, for any given year, you may have a big up and a big down, but just because there is a big down, it doesn’t necessarily mean that’s how it will shake out for the calendar year.
While the market downturn of -20% this year may feel like the world is coming to an end, in fact, it’s pretty normal. Did you know that over the past 40 years, there have been 10 times where there has been a decline of at least 20%?
Average Returns After Downturns have been Positive
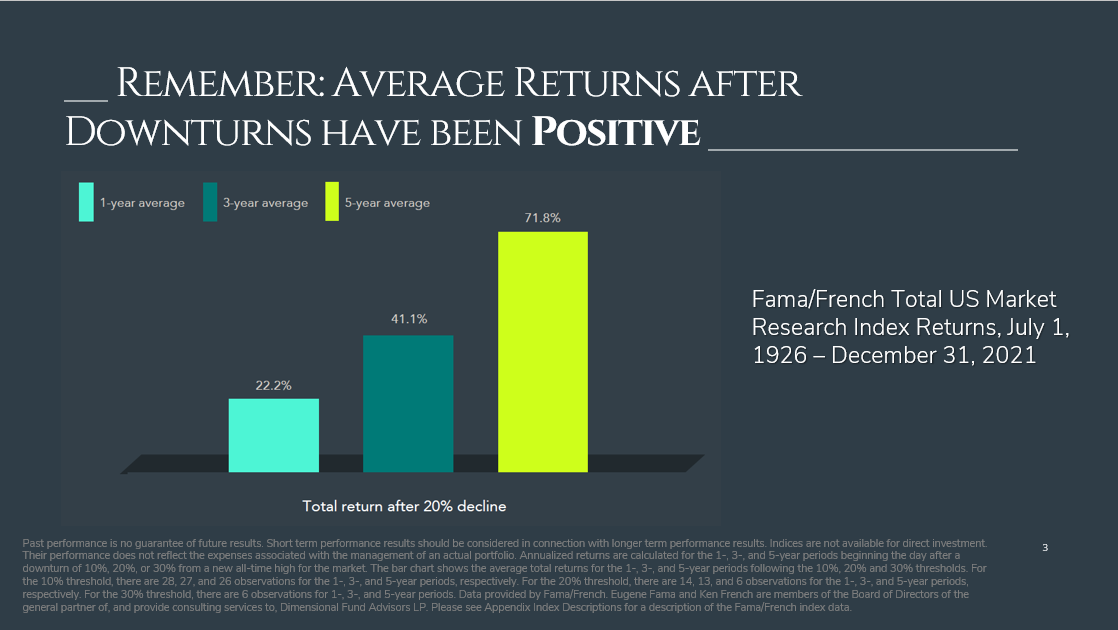
Let’s take a look at all of those times we see a decline of 20%, and what happened next. What happens to the market after a downturn of more than 20%?
The good news is that the future returns are quite good. On average over the past 40 years when the US market was down 20% or more, one year out, the market has recovered and gone up about 22%; 3 years out, 41%, and 5 years out, up 71%.
Fundamentally, as an investor, you must understand that risk and return are related.
So, what about cashing out and waiting for the market to turnaround before buying back in? This is a dangerous tactic that we call trying to “time the market” or “market timing”.
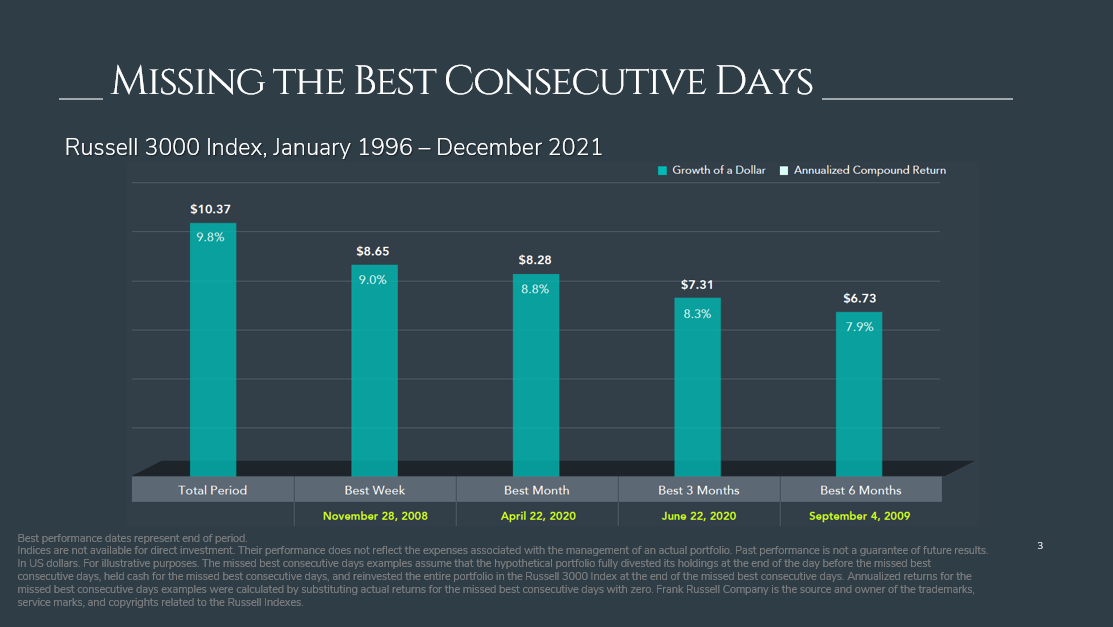
Missing the Best Consecutive Days
Let’s just see what would happen if you couldn’t stomach being in the market, and sold out into cash. In reality, it may feel good in the short term. You might feel some relief that you stopped the bleeding. However, the stress of fearing losses is quickly replaced by the fear of missing out on the market recovery. I’ve seen it, I’ve lived it, and I saw it as recently as during the Pandemic market downturn.
Let’s look the data to examine what happens if you did this, sold out into cash but missed out on some of the initial market recovery.
If we look a 25-year period of being invested, if you were fully invested in the US equity market the entire time, you may have earned a +9.8% return.
But what if you missed the best week, your return would be lowered to 9%.
What if you missed the best month, best 3 months, and best 6 months? Your returns would be even lowered by 10%, 15%, and 20%, respectively. This is the COST of trying to time the market.
Think of it this way. When you cash out and try to get back in at the right time, you have to make two important decisions perfectly right: 1. WHEN to pull out of the market, but equally, if not more challenging, is WHEN to get BACK into the market. The stress of getting back IN the market sometimes is even more stressful than being IN in the market.
Just remember, markets can turn on a dime, and you see positive returns very quickly, both sooner and stronger than expected. In 2020, the market recovered even though we were still in the thick of a global pandemic and rolling lockdowns. It’s not about timing the markets, but rather, TIME in the markets.
Interest Rates Over Time
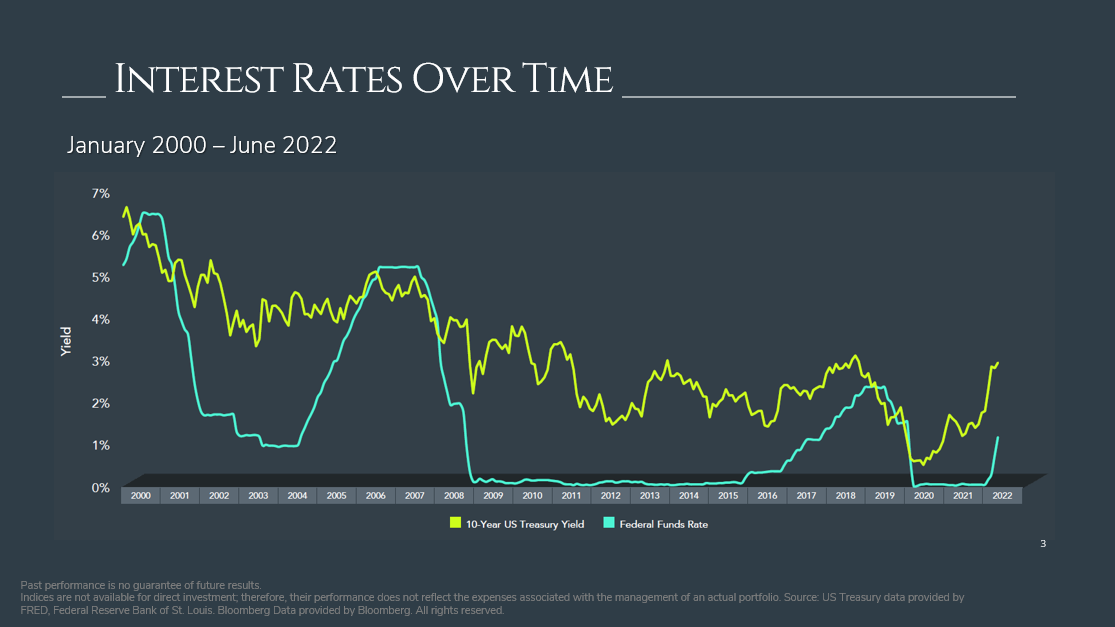
Let’s shift to the Bond Markets.
As mentioned earlier, the prices and markets for bonds have come down this year, in some cases almost as much as the equity markets! This is mainly due to the rising level of interest rates back towards pre-pandemic levels.
As a refresher, when the pandemic hit in March 2020 and global economies were shut down amidst sudden lockdowns, Central Banks around the world tried to prevent economic collapse by responding with interest rate decreases. These rate decreases were like a shot of adrenaline administered to a sick patient – they act like a stimulus to keep the economy going by making it easier for individuals and businesses to borrow money, spend and grow the economy.
Two years later, economies are recovering from the pandemic and therefore Central Banks are now raising interest rates back to pre-pandemic levels. Rising interest rates can cause volatility as the proverbial “punchbowl is removed from the party”, making it tougher for folks to afford higher mortgage payments, and businesses facing higher borrowing costs. Remember, however, why interest rates are rising. It’s because the economy is getting back to normal – as opposed to needing emergency support! Central Banks around the world did emergency rate cuts early on in the pandemic, to prevent a global scale financial crisis. Two years later, it’s promising to see these emergency stimulus measures being removed. It’s kind of like being able to remove the sick patient from life support – because the patient is fortunately showing signs of strength. Of course, it’s often a choppy path when the stimulus is being removed, but… it’s a sign of recovery…and it also builds a margin of safety upon which to draw, if needed in the future.
Let’s talk about Inflation. It’s all over the headline and news that the most recent year over year general level of price increases, aka inflation, +9.1% (June 2022)
- – What does this mean? This is ultimately what we are feeling right now.
- – To fill up your tank of gas with Regular, it will cost you your arm
- – To fill up your tank of gas with Premium, it will cost you your leg
- – At the Premium Plus, it will take your soul
- – At if you are filling up with diesel, say goodbye to your kids!

Jokes Aside. What does the Inflation expectation look like for the next year?
US Breakeven Inflation Rate
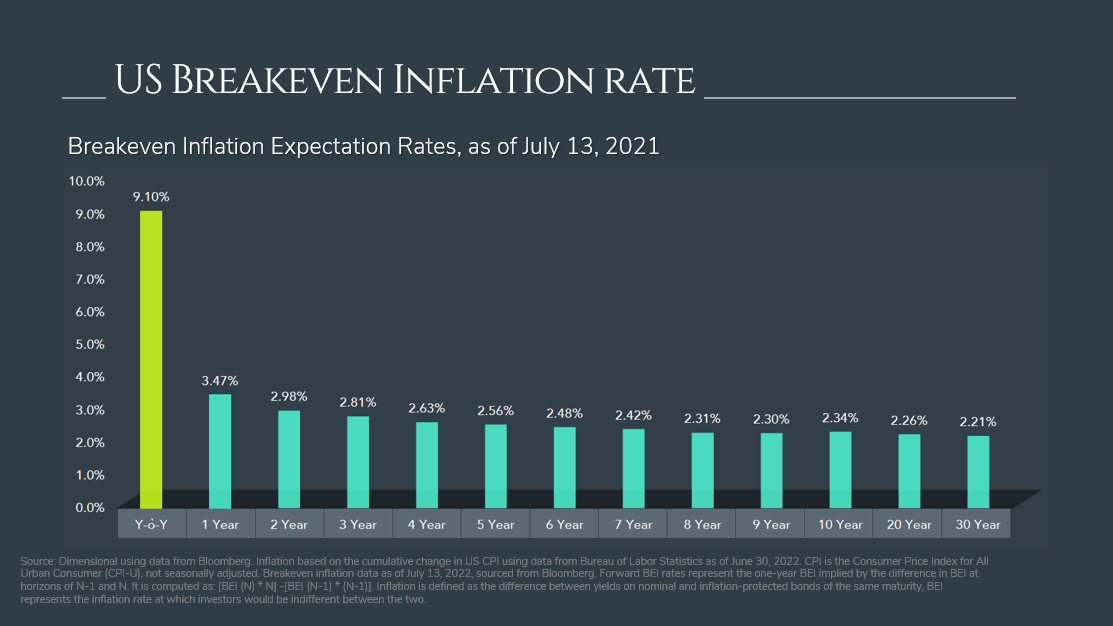
Looking forward to over the next year, we actually think inflation is going to go down. In this chart, we look at inflation expectations, looking out one year from now and 30 years from now. Looking out to 30 years, inflation decreases.
Markets are now expecting inflation to go down as pandemic-related supply chain issues start to ease, and as we roll over to compare year over year price level increases compared to today’s levels, as opposed to last year when many economies were still fairly closed and travel had yet to open up again.
Cooling Inflation Expectations?
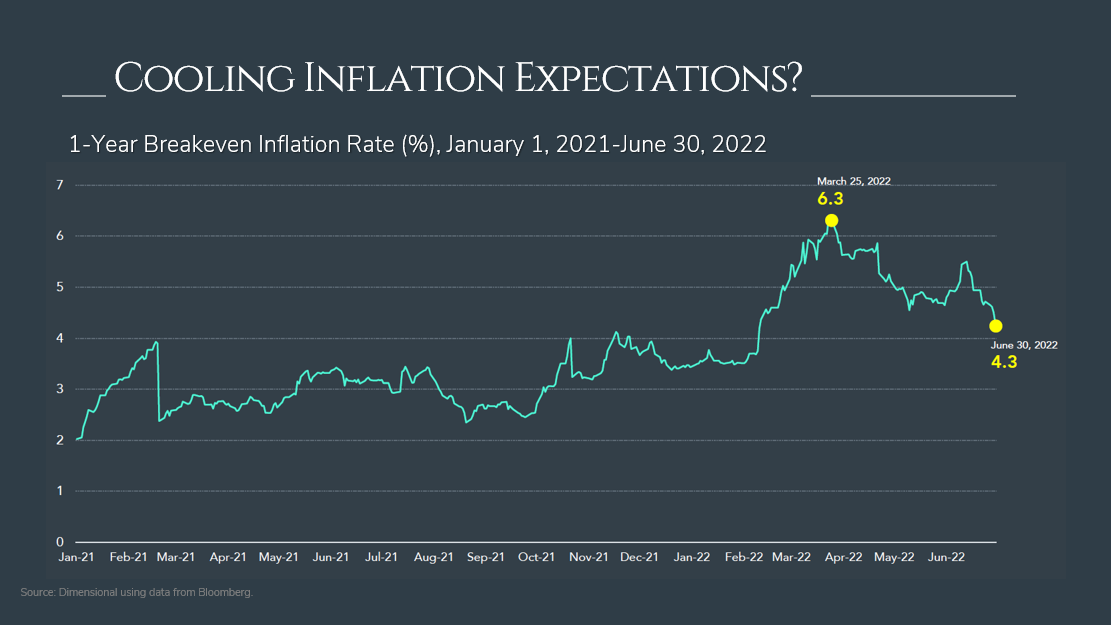
New information comes out all the time. Markets started pricing in increases, which in this chart, peaked on March 25th due to the Ukraine/Russian War which affected energy/food/supply prices affecting global trade. We already see inflation decreasing. Interestingly enough, month over month inflation figures are showing that Inflation is coming back down.
Will Inflation Hurt Stock Returns?
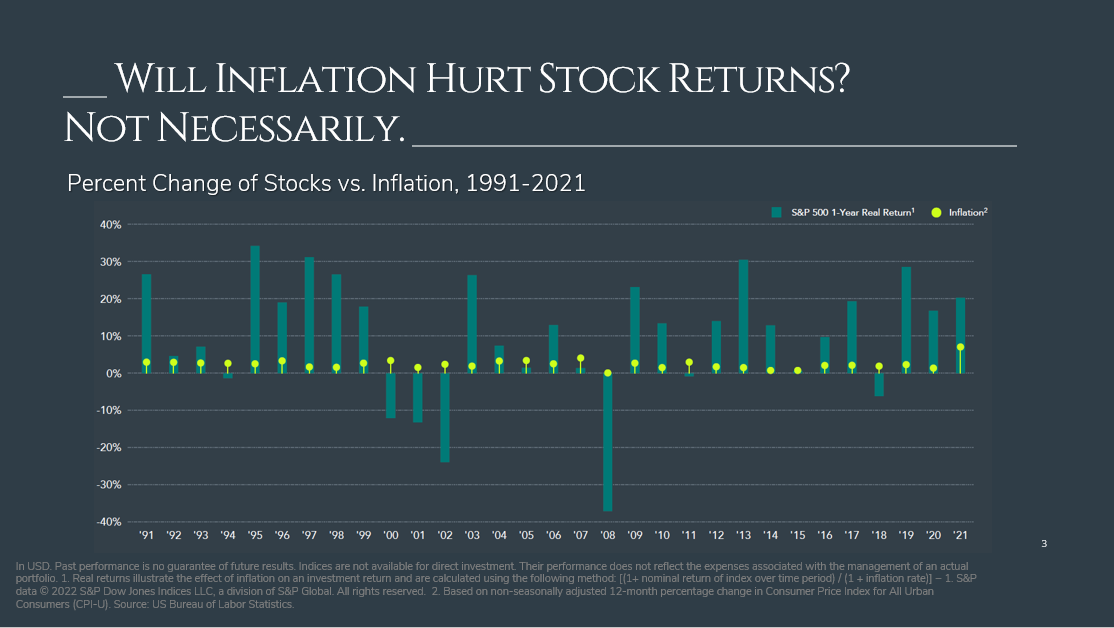
Let’s ask the real question – Do we think that diversified investment portfolios still make money during inflationary times? Yes.
Will inflation hurt stock returns? Not Necessarily.
In this chart that shows the past 30 years, the yellow dots show the positive inflation rate that year, while the blue bars are the real return (return minus inflation) of the S&P500.
Will Inflation Hurt Stock Returns? Focusing on 1970s
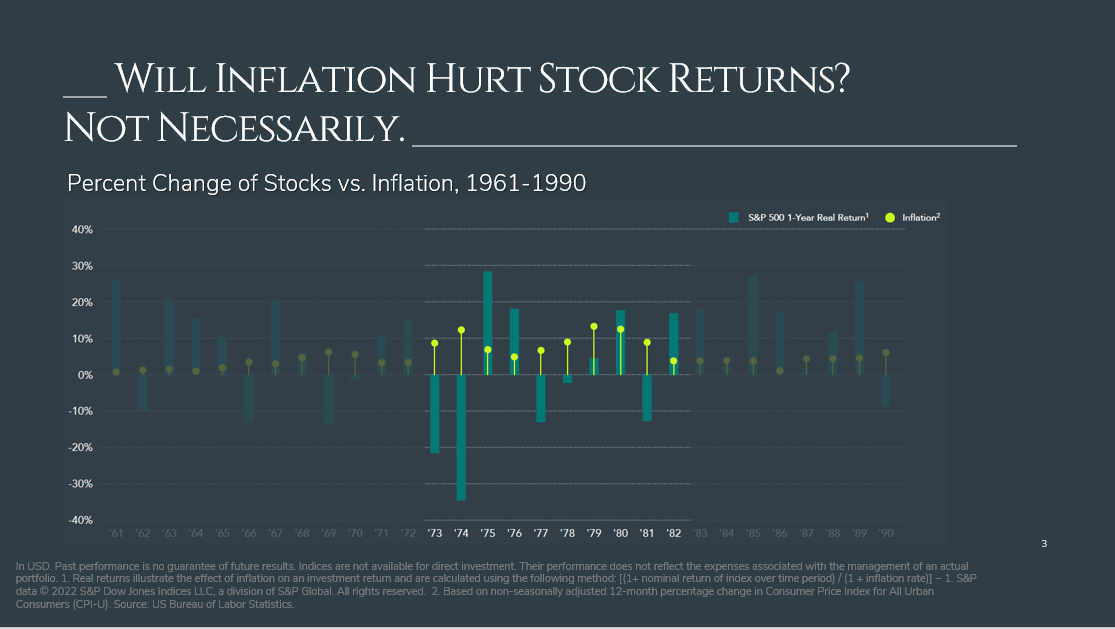
How about during periods of HIGH inflation? Like the 1970’s when Inflation was higher than average. As you can see, inflation didn’t necessarily hurt the real returns on the US S&P 500 index equity returns.
Keeping it Real
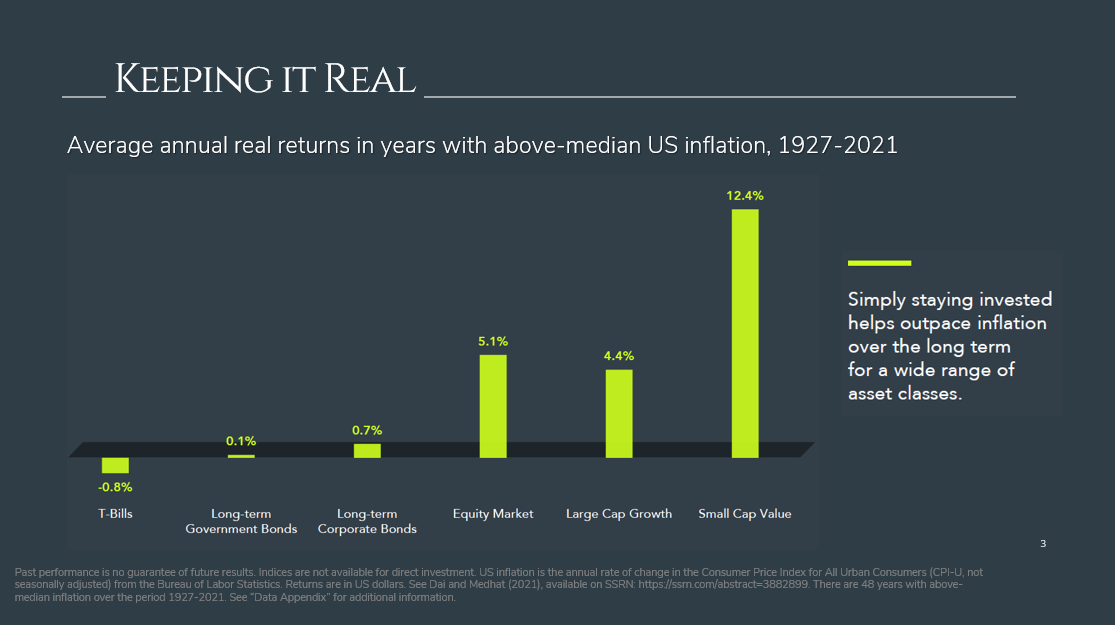
Let’s take a look at what did make money in years when Inflation was above the average level experienced over the past 95 years. How did different asset classes perform when there were high years of inflation?
TBills = -0.8% this means T bills/GIC’s term deposits, cash alternative, after accounting for inflation, this asset class failed to keep pace with inflation.
Govt/Corporate Bonds = outperformed, this return is above and beyond inflation, but not by much
Equity/Stocks = a great way to outpace inflation, they’ve done well, as you can see with the larger growth names and the smaller cap equity names.
Recession / Global Financial Crisis Example
Lastly, I want to address the concerns about the R word – Recession.
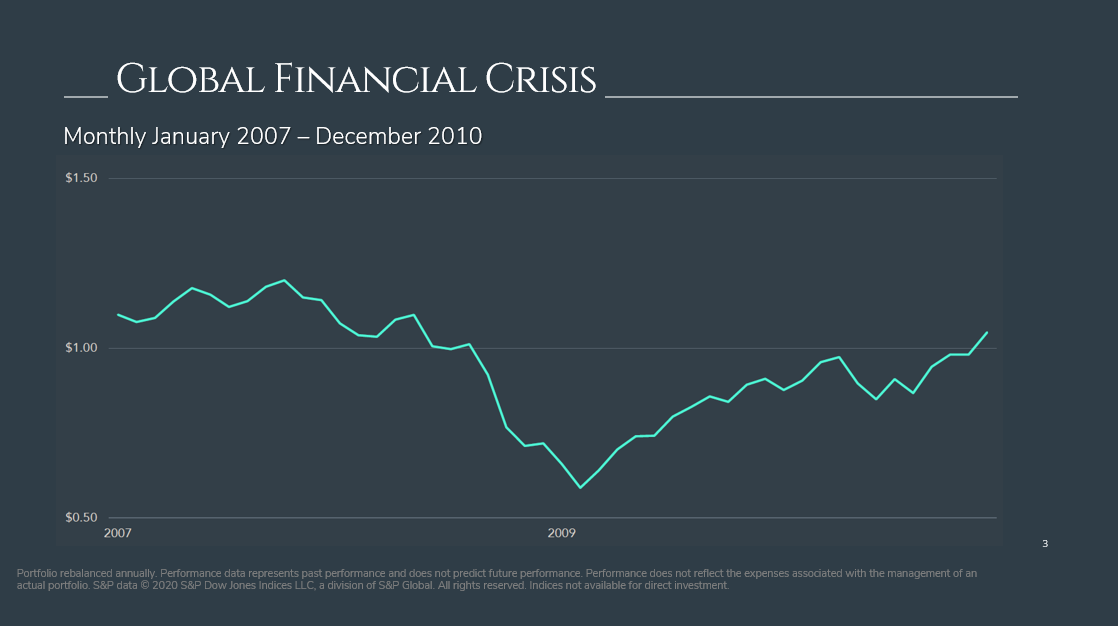
There has been a lot of talk in the media about the risks of a Recession, which means a slow down in the economy, and technically 2 consecutive quarters of negative GDP growth. The last major recession many of us experienced was back in the Global Financial Crisis of 2008, which took place between January 2007-Dec 2010.
This chart shows you a growth of a $1 in stocks during this recessionary time period
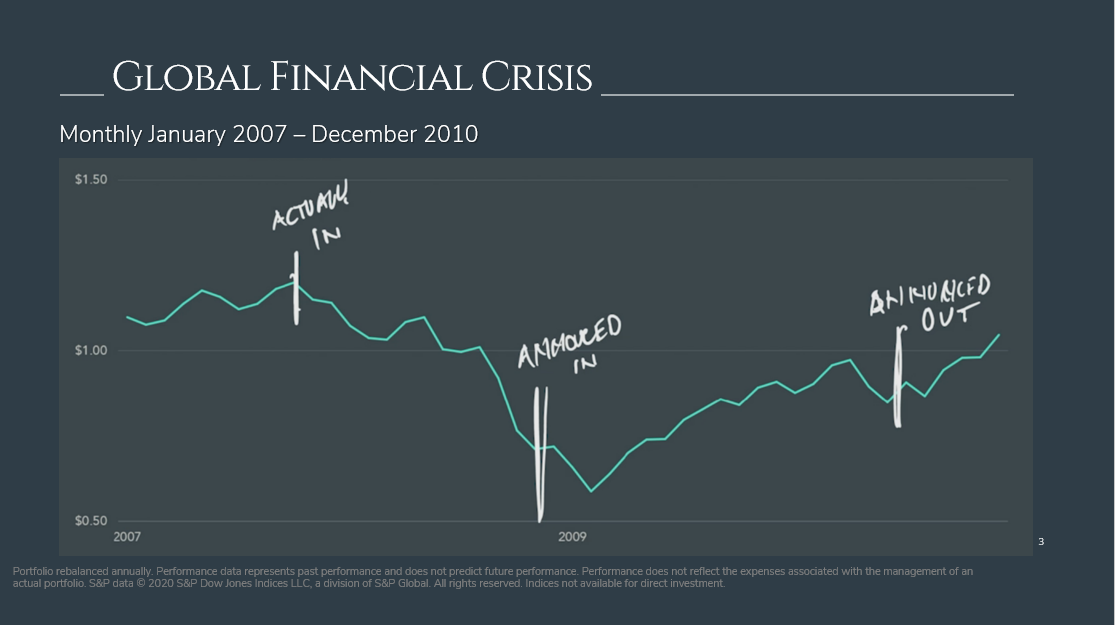
When was recession the Global Financial Crisis announced?
- – In Dec 2008 we were told we were in a recession
When did it end?
- – September 2010
- – Actually, they later told us that the recession started in 2007. But what does that mean to you?
Remember, a Recession means 2 negative quarters of GDP growth. Often times, by the time economists have officially stated that the economy is in Recession, we may already be out of it as they are often short-lived. Markets are instantly pricing this new information into the market constantly. A good example was the recent recession in 2020, but it was short-lived.
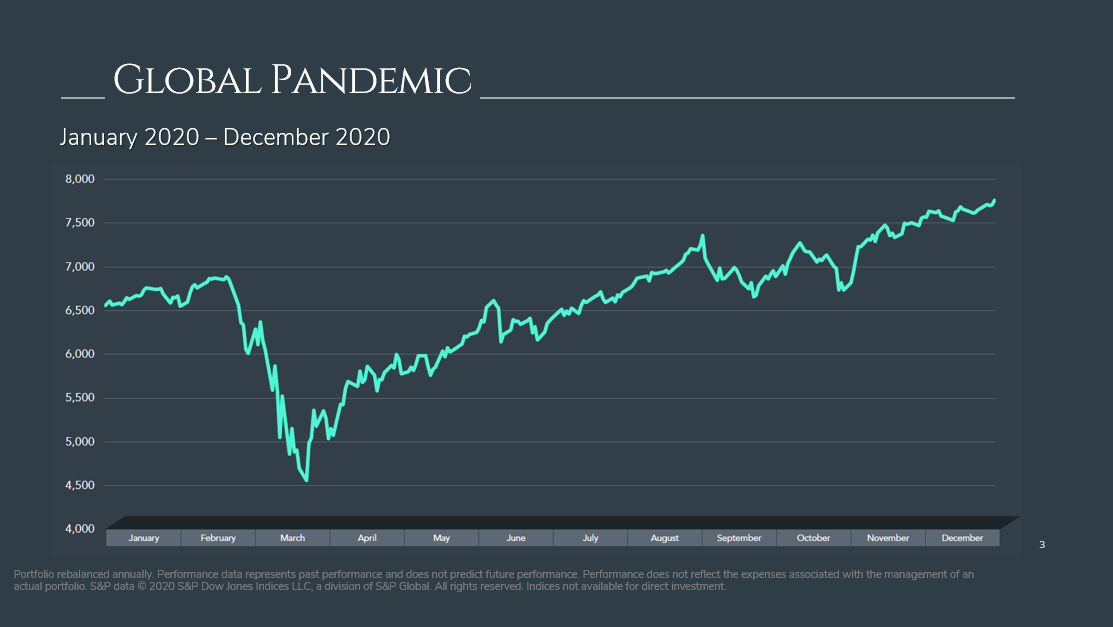
Global Pandemic Recession – January 2020-Dec 2020
Are we currently in a recession? We don’t know yet. What we do know is that recessions are not new, they may look different and be triggered by different causes, but that life and the economy still moves onward and upward. In fact, over the past 100 years, there have been 16 US recessions and every one of them has led to a strong recovery. We need to come back to the fundamental principles.
Markets have Rewarded Discipline / Chart
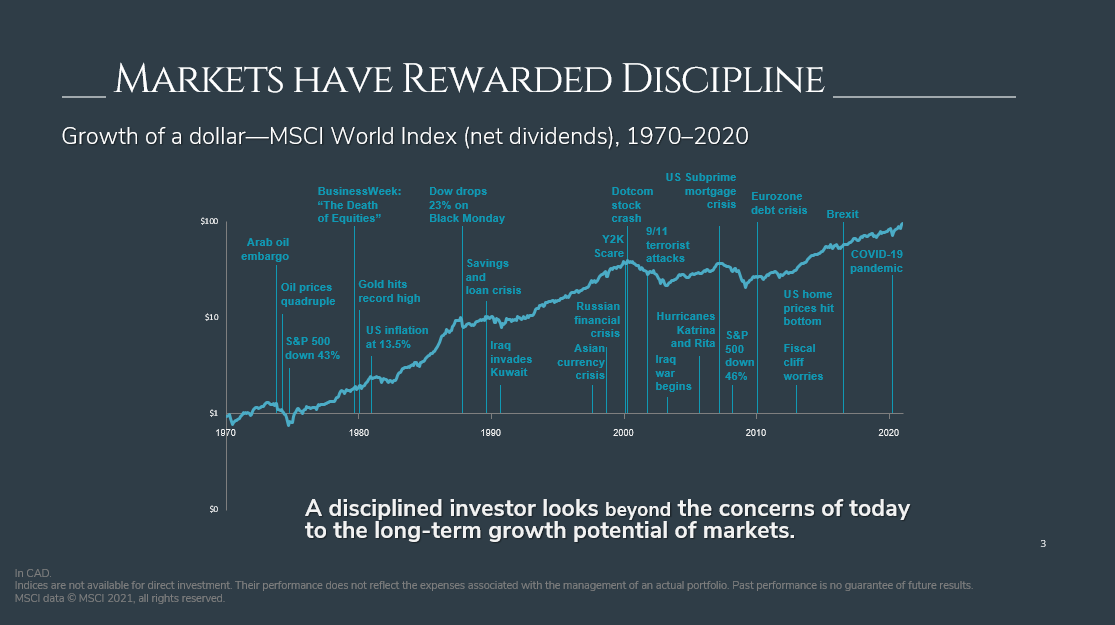
So bottom line, here are some important things to remember:
- 1. Markets Reward Discipline:
- – Don’t fall victim to emotions that may nag you to do something you may regret later. Stay disciplined and invest for the long term.
- – Yes, Global events have a near term and sometimes uncomfortable impact on stock prices. “How much”, “when”, and “What Direction” is uncertain, but what we observe is stock markets recover from negative events, and often recover sooner than you think or before the bad news is over. For instance, in the early stages of the COVID 19 pandemic – the market fell 37% within a short period of time, but then rebounded faster than most expected and well before the pandemic was over.
- – Managing uncertainty is why investors get rewarded with higher returns over time.
- 2. It’s not about TIMING the Market, it’s about Time IN the market:
- – Don’t get seduced by trying to cash out and then buy back in at a more opportune time. For a successful market timing trade to take place, the investor must know exactly when to exit the market, and ALSO exactly when to re-enter the market. This mathematically reduces the probability of investing success. And let’s be honest, watching a subsequent rebound in the markets from the sideline can often be just as stressful as watching the initial market decline.
- – A disciplined investor looks beyond the concerns of today to the long-term growth potential of markets.
Remember, Average Returns after markets have been POSITIVE
History has shown, when markets are down 20%, one year out, on average, you are up about 22%; 3 years out, 41%, and 5 years out, up 71%.
Focus on What You Can Control
- 1. Create an investment plan to fit your needs and risk tolerance
- 2. Structure a portfolio along the dimensions of expected returns
- 3. Diverse globally in high quality growth assets
- a. Our Smart Risk approach builds a diversified portfolio of asset classes for you, all of which react differently to evolving market conditions. Diversifying across asset classes and across geographies, sectors and businesses helps provide strong defense against major global events, while also retaining the valuable upside.
- 4. Uncertainty and returns are related – consider market dips as opportunities to buy high quality assets “on sale”
- 5. Stay disciplined through market dips and swings
- 6. Look beyond the headlines – there could be more than what the media tells you
Logic + Evidence + Diversification + Long-Term Approach = Smart Risk
We’ve been through tough times before and thank you for trusting our process. As always, we are present, focused and prepared to help you, your loved ones, and your portfolio stay resilient and well-positioned to take advantage of the opportunities at hand.
If you’d like to meet with me or one of my associates, please contact us at 778 655 2410 or through our website at www.thewonggroup.ca.
I look forward to connecting with you again soon. Thank you.
Maili Wong, CFA, CFP, FEA
Senior Portfolio Manager, Senior Wealth Advisor
The information contained herein has been provided for information purposes only. The information has been drawn from sources believed to be reliable. Graphs, charts and other numbers are used for illustrative purposes only and do not reflect future values or future performance of any investment. The information does not provide financial, legal, tax or investment advice. Particular investment, tax, or trading strategies should be evaluated relative to each individual’s objectives and risk tolerance. This does not constitute a recommendation or solicitation to buy or sell securities of any kind. Market conditions may change which may impact the information contained in this document. Wellington-Altus Private Wealth Inc. (WAPW) does not guarantee the accuracy or completeness of the information contained herein, nor does WAPW assume any liability for any loss that may result from the reliance by any person upon any such information or opinions. Before acting on any of the above, please contact your financial advisor. WAPW is a member of the Canadian Investor Protection Fund and the Investment Industry Regulatory Organization of Canada.
© 2022, Wellington-Altus Private Wealth Inc. ALL RIGHTS RESERVED. NO USE OR REPRODUCTION WITHOUT PERMISSION.