Why the Yield Curve Matters?
When making investment decisions at West Oak Family Office, we look to the signals from markets and the economy in order to avoid the noise that so many investors tend to get caught up in. The benefit of relying on signals is the ability to look back historically at the probability for either increased return, or increased risk, which helps us in making investment and allocation decisions within portfolios.
One of the signals that we monitor in our weekly data set is the yield curve. The yield curve is simply the interest rate, or yield, along the short-term to long-term bond market and are what the interest rate for personal or business loans are priced off. As the yield curve shifts it provides signals as to when equity markets will likely perform well, and when they may not.
Just last week, a part of the yield curve inverted, which means short-term interest rates are higher than longer-term rates which is unusual and tends to signal a possible recession, and a weak period for stocks. The inversion is being caused by the expectation that central banks (the Federal Reserve in this case) will continue to raise short-term interest rates over the next 12-18 months. When short-term rates are higher than long-term rates, banks tend to curb lending, consumers spend less due to higher interest costs, and corporations invest less due to higher interest costs and tighter financial conditions, which can all lead to a slowing of the economy.
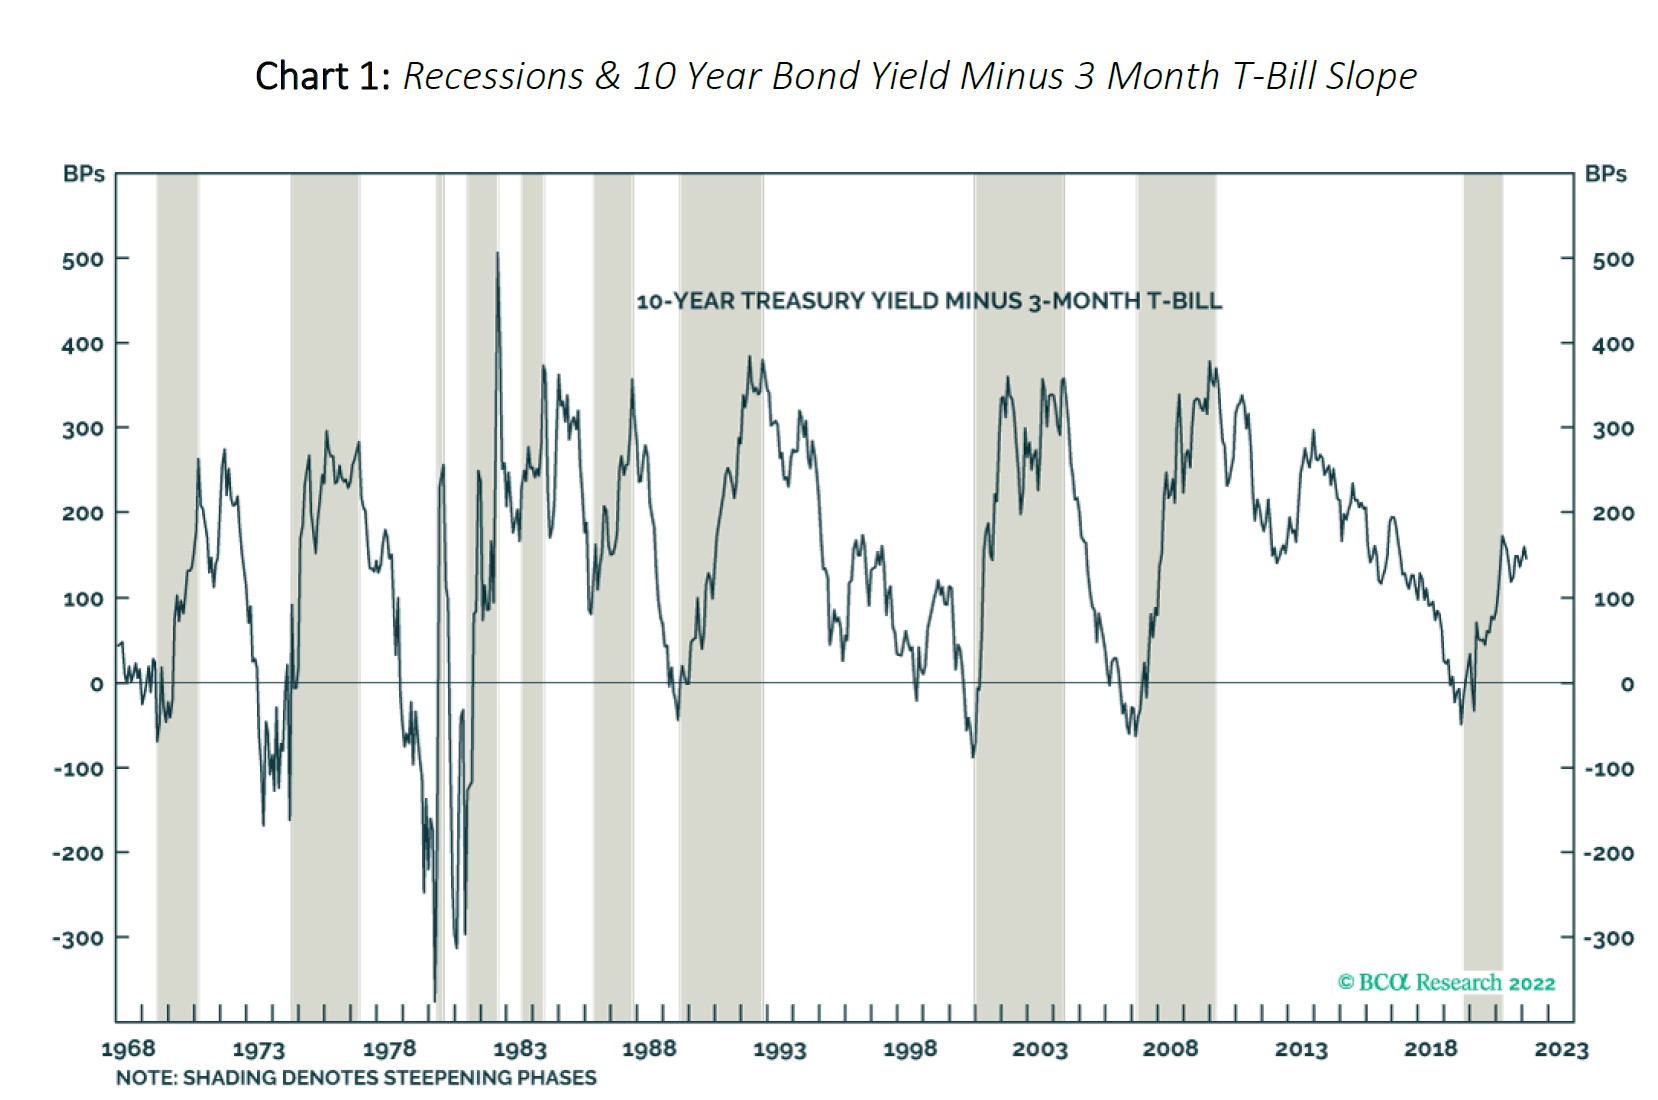
How reliable is the signal from a yield curve inversion in foretelling recession and a weak period for equities? Chart 1 demonstrates that it has been fairly accurate in predicting recessions, going back over 50 years. When the ’10-YEAR TREASURY YIELD MINUS 3-MONTH T-BILL’ line dips below zero it indicates an inversion of the yield curve (i.e. the interest rate on the 90-day T-bill is higher than the interest rate on the 10-year bond). The gray shaded areas in the chart indicate periods of recession. Inversion has foretold 8 of the last 10 recessions. Where it was not a very reliable signal was during the 1980’s, after having come off extremely high interest rates that broke the back of an inflationary period, earlier in that decade. There was also a false signal in 1998, which coincided with the Russian debt default and concerns of a potential global debt crisis in the face of the Federal Reserve raising short-term interest rates at the time, but which ultimately proved to be a ‘contained in Russia’ situation.
However, not all inversions are created equal. Right now, the interest rate on a 2-year government bond is higher than a 10-year bond, but the interest rate on a 3-month bond is still quite a bit lower versus that of the 10-year bond (see chart 2 below). What this tells us is that the risk for a weakening economy and market exists but is very likely not imminent until the 3-month to 10-year slope for interest rates inverts, which it is a long way from doing. Furthermore, history shows that recessions typically occur about 11 months after the 10-year minus 3-month curve inverts and the stock market (S&P500) peaks about 5 months before the onset of an economic recession. With these figures in mind, in our view we remain a ways off from a more challenging economic environment so long the Federal Reserve hikes interest rates in an orderly fashion throughout the rest of 2022 and into 2023.

What are implications for risk assets if more yield curves eventually invert?
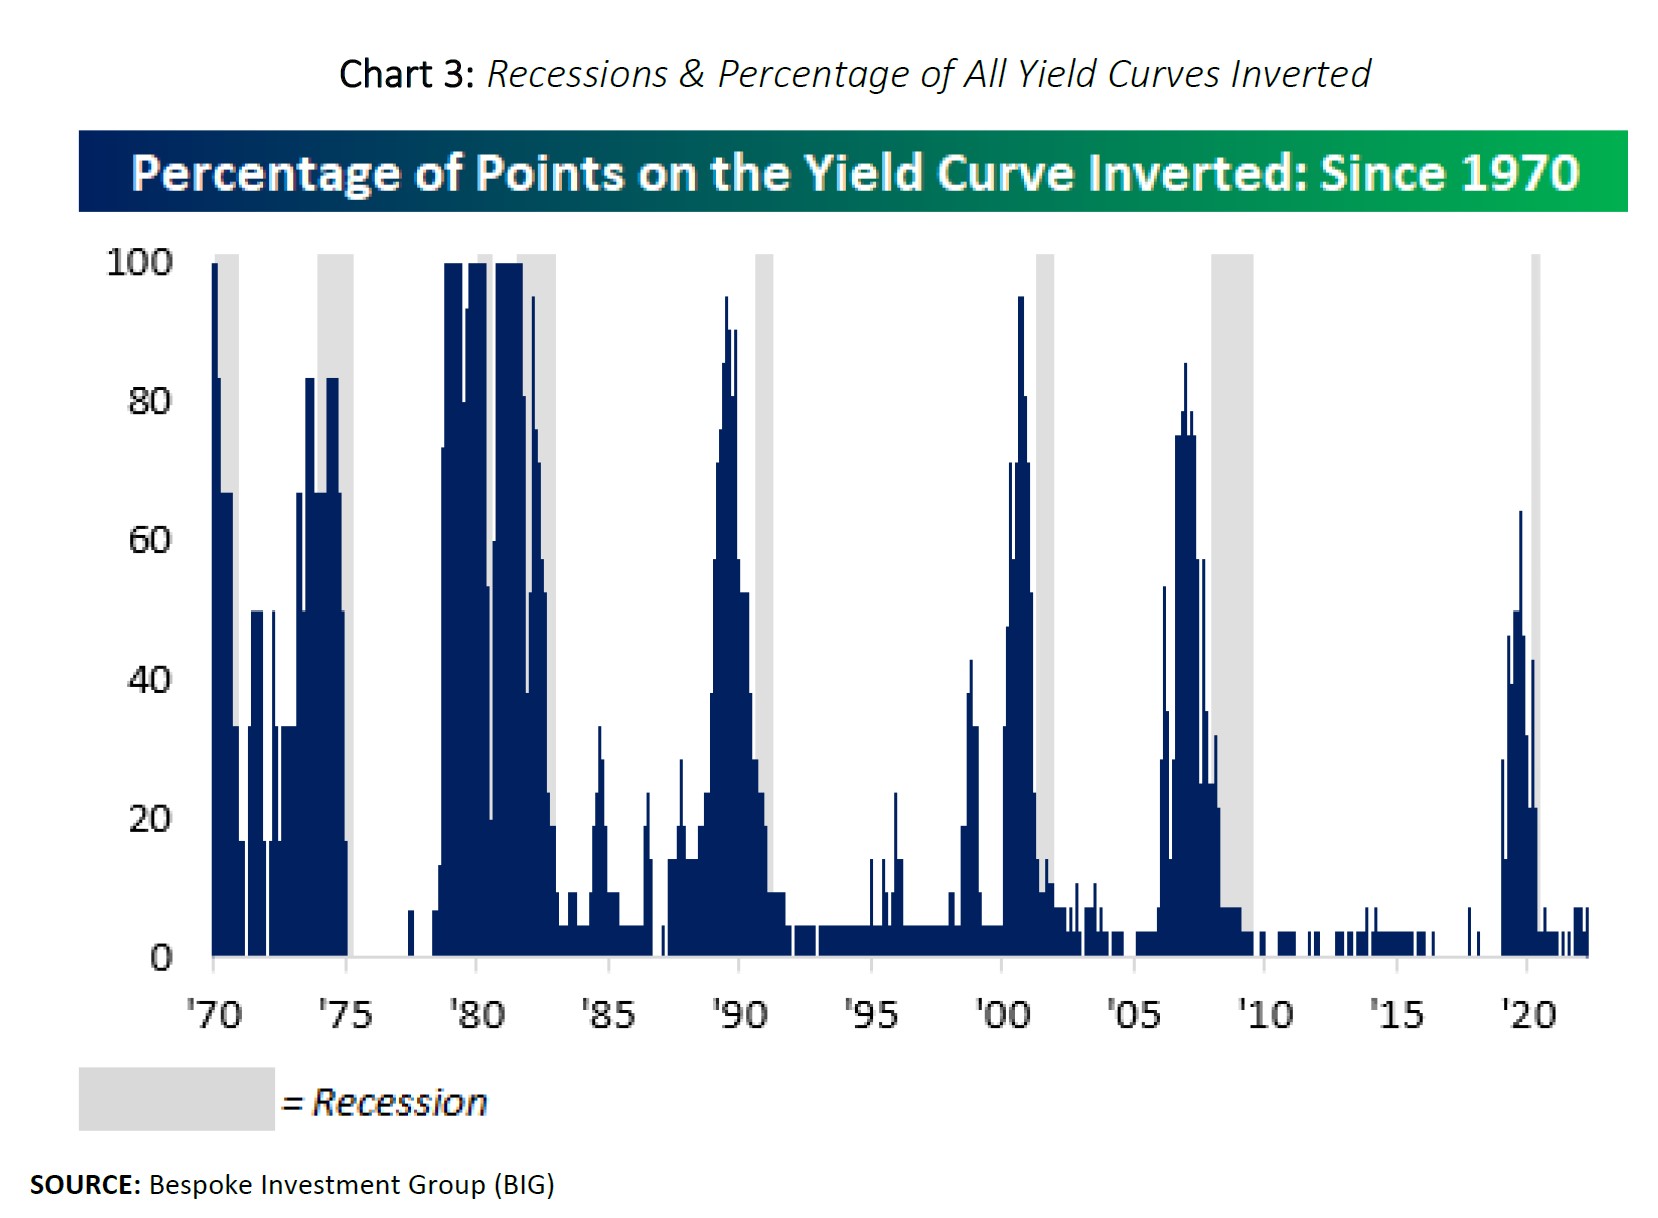
At present, only a small portion of the yield curve has inverted (less than 10% at present), and in order to receive a stronger signal that a recession is in fact coming, in our opinion we would need to see a larger portion of the yield curve invert, ideally north of 50% (see Chart 3 next page). As more of the curve inverts, it usually sets off a series of events that lead to the cycle peak in housing, the economy, consumer wealth and a likely top in stock markets. While the yield curve is not the only factor to predict recessions, it is one of the most significant predictive measures given the cost of money impacts all assets and moreover, impacts spending, corporate earnings growth, and valuations. As things stand today, only some parts of the yield curve and inflation levels are signaling recession, while the remaining factors are mid-late cycle. This leads us to believe that equity markets still have about 12-24 months of upside before we need to worry about an impending recession. Further, all of this assumes the Federal Reserve and the Bank of Canada raise short term interest rates enough through 2022 that results in the 10 year – 3-month yield curve actually inverting. Until then, we will give equities the benefit of doubt before beginning to get more defensive in portfolios, the same as we did in 2019 prior to the bear market in 2020.
As always, we welcome any questions and feedback so please do not hesitate to reach out.
Sincerely,
Andrew, Kelly, Justin, and the West Oak Team
SOURCE: Bespoke Investment Group (BIG)
The information contained herein has been provided for information purposes only. The information has been drawn from sources believed to be reliable. Graphs, charts, and other numbers are used for illustrative purposes only and do not reflect future values or future performance of any investment. The information does not provide financial, legal, tax or investment advice. Particular investment, tax, or trading strategies should be evaluated relative to each individual’s objectives and risk tolerance. This does not constitute a recommendation or solicitation to buy or sell securities of any kind. Market conditions may change which may impact the information contained in this document. Wellington-Altus Private Wealth Inc. (WAPW) does not guarantee the accuracy or completeness of the information contained herein, nor does WAPW assume any liability for any loss that may result from the reliance by any person upon any such information or opinions. WAPW is a member of the Canadian Investor Protection Fund and the Investment Industry Regulatory Organization of Canada.
© 2022, Wellington-Altus Private Wealth Inc. ALL RIGHTS RESERVED. NO USE OR REPRODUCTION WITHOUT PERMISSION.