EXECUTIVE SUMMARY
- Canada is on the precipice of a recession, whereas the U.S. recession is likely to commence at some point in the next few quarters.
- The trifecta of restrictive interest rates, tighter credit conditions due to rising loan delinquencies, and continued deterioration in labour demand creates a headwind for consumers and will very likely tip the economy into recession later this year or in early 2025.
- Bear markets lead recession by 6 months on average and given the expected timing for the economy to succumb, a defensive stance within portfolios is warranted.
- Outside the dot-com bubble, U.S. stocks have never been more expensive which could mean a more pronounced decline to bring the price-to-earnings multiple down from 21x currently, to the long-term average of 16-17x.
Family Office
- Registered Education Savings Plan – As families begin thinking about back to school, we are thinking about Registered Education Savings Plans (RESPs) and some nuances associated with withdrawals:
- There is no limit to the number of withdrawals you can make.
- A current letter of enrollment is required for each beneficiary’s withdrawal, which can usually be obtained through the school’s online portal.
- Capital Gains Inclusion Rate – As announced by the federal government earlier this year, the capital gains inclusion rate increased to 67% for individuals with gains over $250,000 as of June 25, 2024. See our Family Office Feature below article for more information.
Cash Management Strategy
In the event you would like to hold some cash for the short to medium term and would like to earn a better rate than your bank account, we have access to several High Interest Savings Accounts (HISA), some of which are tax efficient in nature. Currently yields are in and around the 5% yield area. For taxable accounts, we use an offering that has a 7% tax equivalent yield for high-tax-rate clients.
Reach out if you would like more information.
Summer Events in YYC
Calgary Folk Festival – July 25 – 28
The 45th annual Calgary Folk Festival returns to Prince’s Island Park this month. A family friendly event with over 70 artists playing. Tickets are on sale now – Click here to view.
LPGA 50th CPKC Women’s Open – July 23 – 28
Coming to Calgary at the Earl Grey Golf Club in July. Star studded golfers like Brooke Henderson, Lydia Ko and Lexi Thompson will be in attendance. Click here for more information on the available ticket packages.
Inglewood Night Market – Aug 9, Sept 6 & 13
A Calgary favourite, the Inglewood Night Market is back! Free to attend, the market features live music, local vendors and is dog friendly! Click here for more information.
INVESTMENT MANAGEMENT FEATURE:
Market Valuations and Performance
The only time that the S&P 500 has been as expensive as it is today, was during the dot-com bubble in 2000. With that said, the overvaluation is concentrated among the 10 largest companies within the index. The conundrum is that over the past year, their overall contribution to earnings to the index stood at 26.8%, which doesn’t align with their total market weight of 37%—putting them at risk of a meaningful valuation correction.
With respect to performance, and diving even deeper on concentration and contribution, the seven largest high-beta-growth stocks in the S&P 500 (the ‘Magnificent 7’) have been responsible for nearly all of the index’s return over the last 2 years, having produced an average return of 30.5% versus the remaining 493 stocks with an average return of just 1.35% annualized (partly based on future estimates to the end of 2024).
The characteristics of overvaluation and concentration of return is reminiscent of the late 1990s, prior to the tech bubble bursting and which lead to a 13-year period where the S&P 500 experienced zero growth, outside of the dividend. One example of the impact ofhigh valuations is Cisco Systems. Despite meaningful earnings and sales appreciation since 2000, Cisco trades 41% below it’s all time high reached in 2000. The concern is that high-flyers such as Nvidia end up sharing the same fate as Cisco.
While we do have an allocation to high-beta-growth technology across the portfolios we manage, we pair that with our U.S. value-based strategy where our current price-to-earnings ratio stands at 13.8x and the profitability metrics such as return on equity and free-cash-flow yield are twice that of the broader index. This allows us to smooth returns but most importantly, manage the risk of excessive valuations, and we remain tactical with an intent to reduce exposure to high-beta-growth as markets shift.
FAMILY OFFICE FEATURE:
Tax Fairness and the Capital Gains Tax
The anticipation is over! The capital gains inclusion rate has increased to 67% (this rate applies to corporations and trusts, and individuals when capital gains are above $250,000) in an effort to make Canada’s tax system more fair. The story line is that the new inclusion rate will only affect the “very richest” people in Canada and will generate significant new revenue. This makes me think of the adventures of Robin Hood, but even if Trudeau pulled on his robin hood boots, this too may only be folklore.
The 2024 federal budget highlights that Canada has struggled with productivity growth, and that “the key to unlocking Canada’s full economic potential is building confidence for businesses to make investments needed to improve productivity and keep pace with rapidly developing markets”. However, the Fraser Institute comments that “capital gains taxes impose economic costs by distorting behaviour,” plot twist!
Graph a:
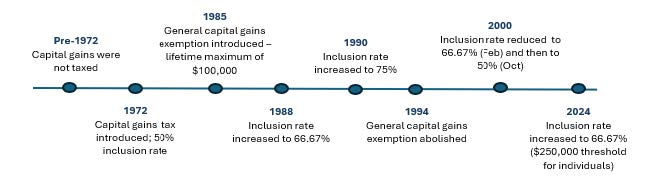
The capital gains inclusion rate was introduced in 1972, and from the following timeline, you can see it has had its share of ups and downs (see: Graph a)
The people at the Fraser Institute say that taxes on capital gains do raise revenue, however, they also say the economic costs exceed the tax collected because it reduces the incentive to innovate and invest. This could make our current economic situation even worse, and clearly not the happy ending the government is hoping for.
Where does this leave us? Waiting for the sequel of course, but in the interim, being more strategic with our year-end planning by deferring (or triggering) gains, spreading gains over multiple years, donating publicly traded securities and using insurance to protect assets earmarked for a subsequent generation or community gift.
OUTLOOK
Consumption represents approximately 70% of total economic output and has been the key driver of the post-pandemic expansion. Because of this, we at West Oak spend a good deal of time focusing on the health of the consumer and leading factors around wage growth, lending conditions, interest rates and liquidity conditions that help guide our portfolio asset allocation decisions. The consumers ability to consume comes in three different forms:
- spending past income, or savings.
- spending current income, with the ability to spend more as they earn more (wage growth); and
- spending tomorrow’s dollars through borrowing.
When we look at Canada we have concerns around highly levered households, restrictive interest rates, increasing unemployment, and a deflating real-estate bubble in Vancouver and Toronto which point to a near certainty of recession for Canada—likely to be confirmed in the coming months. In contrast, because the U.S. consumer went through a deleveraging period following the housing collapse and global financial crisis, along with having a more diversified and business friendly economy, they have managed to stave off recession, for now. With that said, there are chinks in the armour which point to a slowdown in consumption in the months and quarters ahead and will likely lead to recession later this year or early in 2025. The number of job openings continues to fall
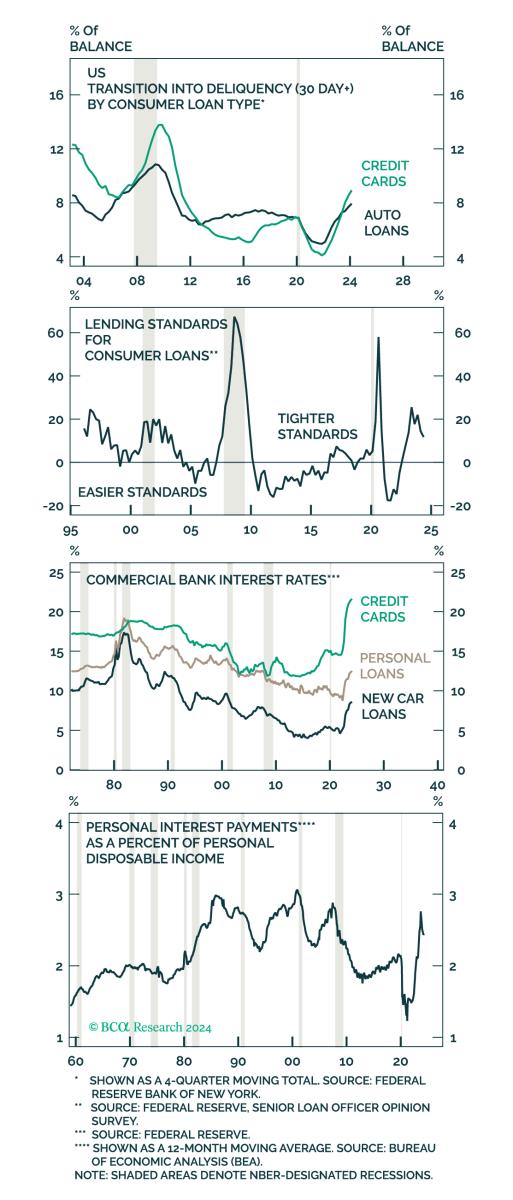
(see: Chart 1.) and the unemployment rate continues to tick higher, leading to further wage growth suppression. Higher interest rates are beginning to take their toll as is demonstrated by increasing delinquencies on auto and credit card loans (see: Chart 2.)
Lastly, the excess savings that accrued during the pandemic have all been used up.
The question is: how much could the market (S&P 500 index) fall during the next recession? A bear market is defined as a contraction of 20% or more, and when we look at the US market, we believe we could see a decline somewhere in the 30-35% range. We come to this estimate based on our expectation for a mild recession and a 10% decline in earnings for the S&P 500
Chart 1. There are Fewer Opportunities for Job Seekers
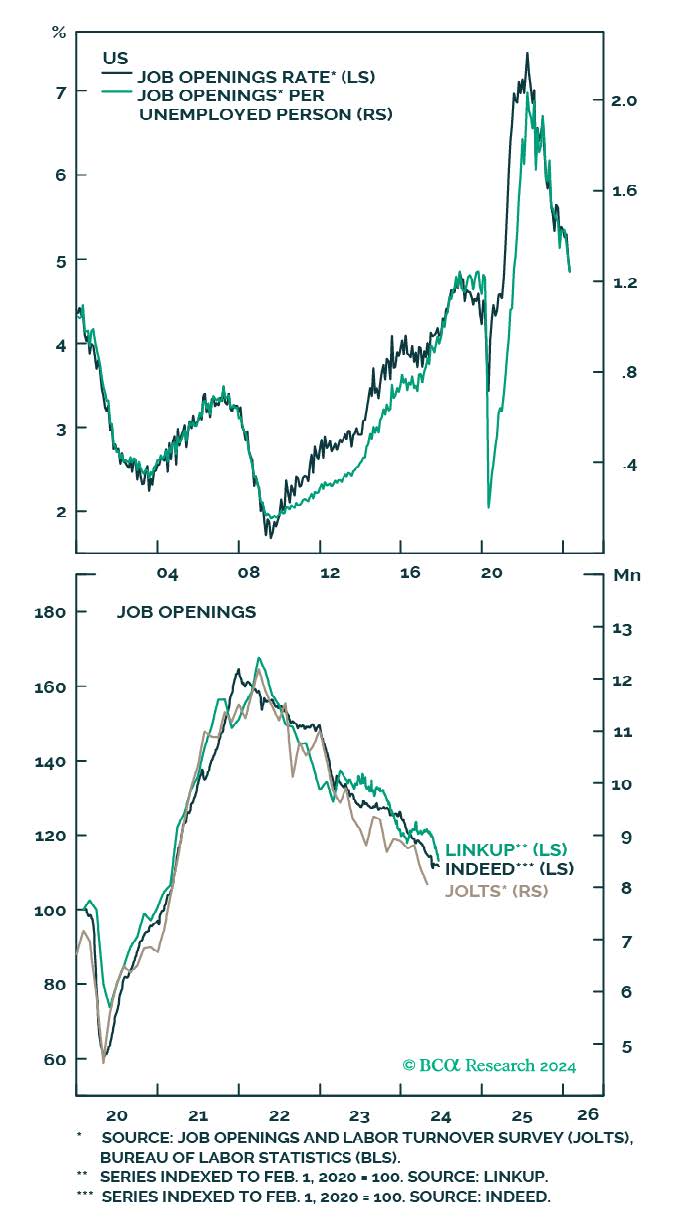
Chart 2. Negative Outlook for Consumer Loan Growth
along with a price-to-earnings multiple of 16x, which is more inline with the average historical multiple, relative to the current multiple of 21.1x.
Bear markets for stocks coincide with economic recessions and markets lead recessions by six months on average (see: Table 1.). This has led us to reduce equity exposure in favour of low-risk government bonds which appreciate during recessions as interest rates come down. This not only protects capital during a market decline but more importantly, creates opportunity to shift back to equities at much more compelling levels. While we aren’t certain on the exact
Table 1. On Average, Stocks Have Peaked Six Months Before the Onset of Recession
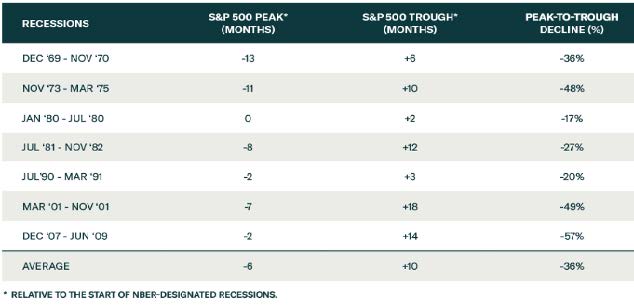
timing for when the recession in the US will begin, we are confident in our call to wait for our chance to position capital opportunistically and to generate outsized returns without altering the risk profile of portfolios.
As always, we appreciate any questions or feedback so please don’t hesitate to reach out should you wish to visit in more detail.
Sincerely,
Andrew, Kelly, Justin & the West Oak Team