Big Events in Calgary
Chinook Blast Winter Festival: Visit Eau Claire Plaza between January 30 and February 16 to enjoy Calgary’s signature winter festival. It unites partners from the arts, nonprofit, neighbourhood, tourism and sports communities to celebrate the spirit of the city in an inclusive and vibrant way.
To learn more, visit Chinook Blast.
Skijordue ’26: Skijoring is the fastest growing winter sport in North America, drawing a diverse group of participants spanning generations and genres to dynamic events showcasing skills, speed and style. Skijordue is taking place at the Confluence Historic Site in Calgary on February 21 & 22, 2026.
Visit Skijordue ’26 for more information.
EXECUTIVE SUMMARY
Reflection and Outlook
Family Office
REFLECTION AND OUTLOOK
Looking Back at 2025
This past year brought plenty of surprises. Markets had to navigate political tension, shifting trade policies, and an unusual amount of uncertainty. Even with these challenges, including a sharp U.S. market pullback in April, stocks ultimately proved resilient. Falling inflation, lower interest rates, and strong corporate earnings helped markets recover and finish the year on a high note.
We took advantage of the market volatility by adding more to stocks and private credit at attractive prices. In Canada, real estate faced pressure from changing immigration policies, tariffs, and an oversupply of housing in major cities. Both the Bank of Canada and the U.S. Federal Reserve continued lowering interest rates, helping support slower but steady economic growth. By year’s‑end, global stock markets reached new highs, driven by rapid investment in AI and technology, which some believe could be the early stages of an AI‑driven market bubble.
Looking Ahead to 2026: Both Opportunity and Uncertainty
We are entering 2026 with cautious optimism. Continued government stimulus in the U.S. and ongoing investment in AI infrastructure could support further economic growth. Inflation is easing, but the labour market is softening, and consumer spending is slowing, which are signs that the economy is late in its cycle. A recession is still possible, especially if AI‑related profits don’t materialize as expected or if a major geopolitical event disrupts markets. At the same time, lower interest rates and strong corporate earnings could continue to support stock prices. Because predicting the exact turning point of a cycle is nearly impossible, we prefer to prepare for a range of outcomes rather than focusing on one specific outcome.
Portfolio Positioning
To balance growth opportunities with potential recessionary and geopolitical risks, we are positioning portfolios with a mix of stability, diversification, strategic upside and possibly some equity market hedging:
The Road Ahead: Staying Diversified and Prepared
Successful long‑term investing is about staying invested in well-managed growing companies while managing risks thoughtfully, especially late in a market cycle. Stocks remain the strongest long‑term driver of wealth, while bonds help smooth the ride during periods of uncertainty and provide opportunities to buy equities at better prices. We believe broad diversification across asset classes and regions, combined with prudent opportunistic risk‑management tools will help create a more successful long-term investment experience until valuations improve and geopolitical risks abate.
FAMILY OFFICE FEATURE:
2026 Tax Facts, Figures and Future Planning
CRA Tidbits
Tax Filing Deadlines and Details
RRSPs and RRIFS
TFSAs, FHSAs and RESPs
INVESTMENT MANAGEMENT FEATURE:
Investment Booms: Lessons from History and Today
Investment cycles often follow a familiar pattern: optimism about transformative technologies drives valuations to extreme levels, followed by periods of correction. Understanding these dynamics can help investors navigate today’s market environment and manage the growing risks of the current Supercycle in AI.
Historical Precedents
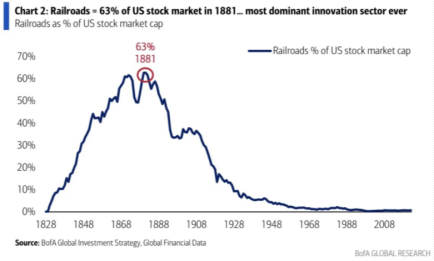
In the 19th century, the railroad industry sparked one of the largest investment booms in history. Railroads were seen as revolutionary, attracting massive speculative capital. Research by Carlson (2025) and the FDIC shows that financing was heavily reliant on long-term debt, which created systemic risk when growth slowed. This episode illustrates how infrastructure-driven booms often hinge on optimism, leading to overvaluation and eventual correction. At its peak, railroads accounted for 63% of the U.S. stock market.
Similarly, in the years leading up to the 1929 crash, valuations reached unprecedented levels. Historical accounts reveal that price-to-earnings ratios soared far beyond sustainable levels, signalling irrational exuberance. The lesson is clear: when valuations rise without proportional earnings growth, markets become vulnerable to sharp reversals. For now, AI profits have been rising despite the labour market weakening; however, this bears watching further as investors appear to be doubling-down on AI technology stocks given the narrative around data-centre buildouts on earth and even in space with the help of Elon Musk’s SpaceX.
The Modern Parallel: AI Investment Surge
Today, AI is driving a new wave of investment enthusiasm. Bloomberg reports that AI-related equities dominate market capitalization, with the “Magnificent 7” now accounting for ~35% of the S&P 500. If you include companies like Alphabet, Meta, Disney, Amazon and Tesla, technology stocks account for > 55% of the U.S. stock market. Price-to-earnings ratios for leading AI firms far exceed historical averages, echoing patterns seen in previous bubbles.
However, there are crucial differences in funding dynamics. According to Richard W. Paul & Associates (2025), AI companies rely more on equity financing and venture capital than on debt. This reduces systemic credit risk but concentrates exposure in equity markets, creating a different risk profile compared to past booms.
Railroads vs. AI: Key Similarities and Differences
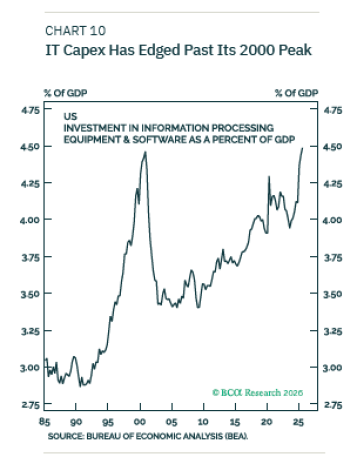
Both the railroad and AI booms share common themes: transformative technology narratives and rapid capital inflows fueled by expectations of long-term dominance. However, the differences are significant. Railroads required heavy physical infrastructure and debt financing, while AI is relatively asset-light and scales through software and cloud infrastructure on a global basis. Additionally, global diversification today helps mitigate concentration risk compared to the U.S.-centric nature of
the 19th-century railroad boom. AI technology companies are also spending free cash flow and operate mostly on the software as a service subscription-based (SAAS) model, which is helping finance the mega boom in datacentres and learning language models (LLMs) development. Compared to railroard investments, which represented about 6% of U.S. GDP back in the 1880s, today’s technology companies are spending about 4.5% leading one to believe that the cycle could still wear on for some time yet. Finally, technology companies today have very manageable debt levels, which can further reduce systemic risk for equity market investors.
Is AI a Bubble?
Opinions vary, although there we have no doubt by virtue of U.S. technology dominance that we are closer to the end of the cycle vs. the beginning. Some analysts argue that AI is foundational, akin to electricity or the internet, and therefore justifies premium valuations. Others caution that current multiples and market concentration mirror historical bubbles, suggesting vulnerability if growth falters and profitability starts to decline. Our view is, AI is a bubble in the making, meaning we are not likely at the peak; however could see a blow off top in the U.S. equity market with technology and technology related stocks accounting for more than 60% of the index at peak optimism. From that point onward, we would say the risk vs. reward is not incredibly attractive and therefore would advocate for greater global diversification and some market insurance protection through put options.
As always, thank you for your continued trust. If you have questions about your portfolio or want to discuss strategy in more detail, we’re here to help.
Sincerely,

Andrew, Kelly, Justin & the West Oak Team